

 Founder Data Report
The Share of US Employers Under Six Years Old Rose Every Year From 2014 to 2022. Their Share of Jobs Barely Moved
You can’t afford to risk your business without a Sidekick at your side.
Census counts of every US employer firm by age: the young share fell for a quarter century, then turned in 2014 and rose every year to 2022. The jobs did not follow.
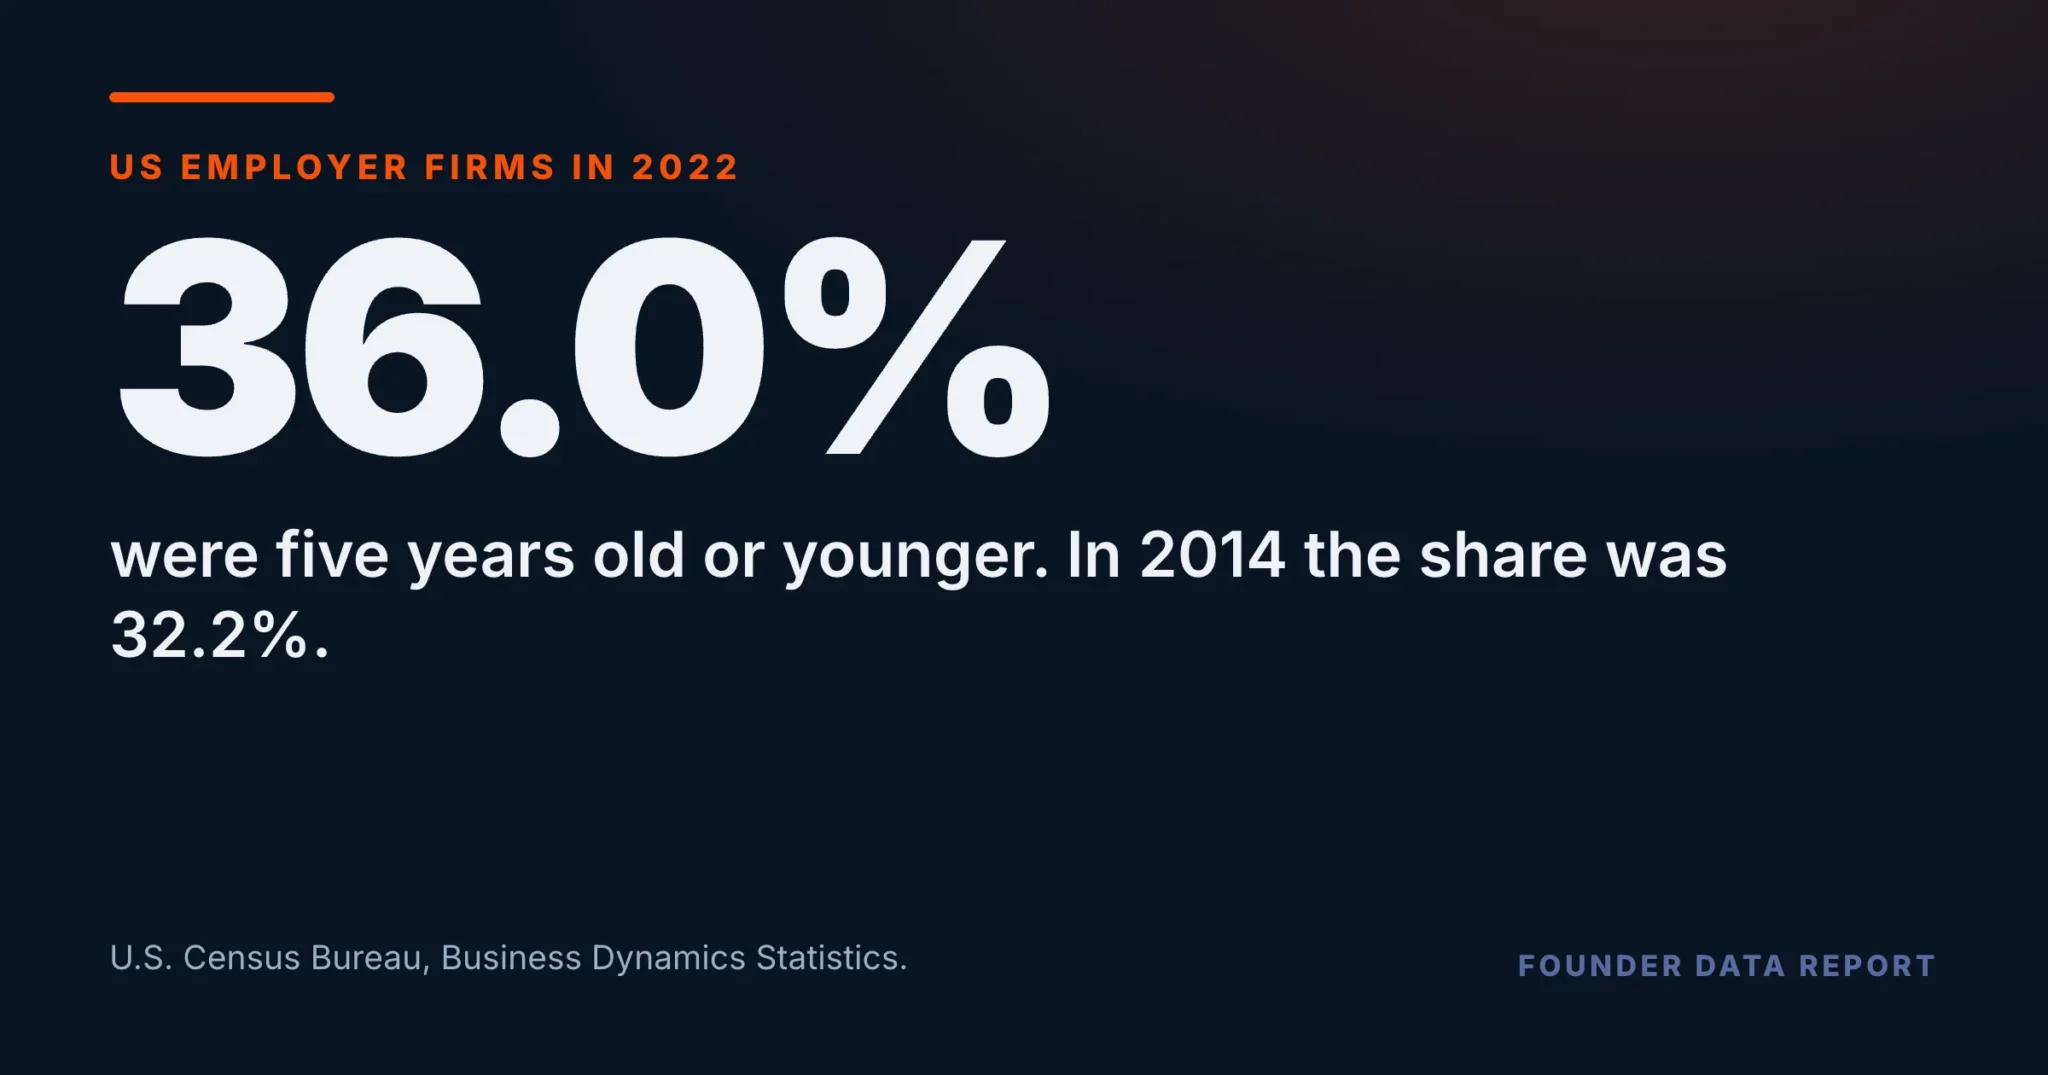
In the Census Bureau’s Business Dynamics Statistics, employer firms aged five years or younger were 32.2% of all US employer firms in 2014 and 36.0% in 2022, higher in every year between. Over the same years their share of the jobs at employer firms went from 10.6% to 10.9%. In the late 1980s, young firms were 45.5% of employers.
- Firms aged five or under: 32.2% of US employer firms in 2014, 36.0% in 2022. The share was higher than the year before in each of those eight years.
- Their share of jobs stayed between 10.5% and 10.9% every year from 2012 to 2022.
- There were 1,997,182 young employer firms in 2022, 21.6% more than in 2014. Older firms grew 2.5%.
- The long view runs the other way: young firms were 45.5% of employers in 1987 and held 18.4% of jobs in 1989.
- These are counts of firms by age, not an account of why the mix changed.
A turn in 2014
Census’s Business Dynamics Statistics count every US business with employees each March, and give each one an age. Measured as a share of all employer firms, the youngest group, firms aged zero to five, was 44.9% in 1982 and peaked at 45.5% in 1987 and 1988. From there it drifted down for most of a quarter century, to 32.2% in 2014, the lowest share anywhere in the 1982–2022 series. Then it turned. The share was higher than the year before in 2015, 2016 and every year after, to 36.0% in 2022.
Firms aged 0 to 5 as a share of all employer firms, counted in March. Every fourth year shown. The axis starts at 30%.
U.S. Census Bureau, Business Dynamics Statistics, firm-age tables (BDSFAGE), 1978–2023 release, employer firms, United States, retrieved from www2.census.gov on September 18, 2026. Young = firms aged 0 to 5 years. 2023, the release’s newest year, is excluded as provisional.
The series starts in 1982 for a reason. The Census tables only know a firm’s age if they saw it start, and they start in 1978; until every age from zero to five could be measured, the young share is understated. From 1982 every one of those ages is counted directly, and so is the total. 2023 is the newest year in this release and the least settled, so it is left off as provisional; at 36.2% it would not change the picture.
Firms aged 0 to 5 as a share of all employer firms, counted in March. The axis starts at 30%.
U.S. Census Bureau, Business Dynamics Statistics, firm-age tables (BDSFAGE), 1978–2023 release, employer firms, United States, retrieved from www2.census.gov on September 18, 2026. Young = firms aged 0 to 5 years. 2023, the release’s newest year, is excluded as provisional.
More of America’s employers are young than a decade ago. Their share of its jobs has barely moved.
More firms, about the same share of jobs
The count behind the share: 1,642,396 employer firms aged five or under in 2014, 1,997,182 in 2022, up 21.6%. Firms older than that grew 2.5% over the same years. The number of firms in their first year went from 411,948 to 521,312. The jobs are a different line. Young firms held 10.6% of the jobs at employer firms in 2014 and 10.9% in 2022, and the share stayed between 10.5% and 10.9% in every year from 2012. On average, a young firm employed 7.8 people in 2014 and 7.3 in 2022; in 1989 the figure was 8.4.
Firms aged 0 to 5. Slate is 2014, orange is 2022. Both rows on one scale, so the jobs bars are drawn against the firm share.
U.S. Census Bureau, Business Dynamics Statistics, firm-age tables (BDSFAGE), 1978–2023 release, employer firms, United States, retrieved from www2.census.gov on September 18, 2026. Young = firms aged 0 to 5 years. 2023, the release’s newest year, is excluded as provisional.
What to take from this if you are in your first five years
If your business is under six years old, firms your age make up a larger share of all employers than in any year since 2009. The data says something narrower than it can seem to: it counts firms and jobs by age, and it does not say why the share turned in 2014, or whether the new firms are smaller by choice or by circumstance. What it does show is that the growth in young firms has come in the number of businesses, and barely in their share of jobs. For an owner, the useful question is the one under the average: is your headcount the plan, or the default?
Three limits worth holding. These are employer firms only, so owners with no employees are outside them. A firm’s age is the age of the business, not the owner’s experience. And the figures are averages and shares across millions of firms; they cannot say how any one business grew.
U.S. Census Bureau, Business Dynamics Statistics.
Frequently Asked Questions
What share of US businesses are young?
In 2022, 36.0% of US employer firms were five years old or younger, in the Census Bureau's Business Dynamics Statistics.
Has that share been rising?
Yes, since 2014. It was 32.2% that year and was higher than the year before in every year to 2022. Before 2014 it had mostly fallen, from 45.5% in 1987.
Do young firms hold more of the jobs now?
Not much. Their share of jobs at employer firms was 10.6% in 2014 and 10.9% in 2022, and stayed between 10.5% and 10.9% every year from 2012.
Why does the series start in 1982?
The Census tables begin in 1978 and can only date a firm they saw start. From 1982 every age from zero to five is measured directly.
Where does the data come from?
The U.S. Census Bureau's Business Dynamics Statistics, firm-age tables, which count every US employer firm each March. 2023, the newest year, is provisional and left out.
Published by The Lonely Entrepreneur — the community and coaching platform for entrepreneurs who are building alone. lonelyentrepreneur.com
This article is for educational purposes and is not a substitute for professional financial or legal advice.