

 Founder Data Report
A Young Business Is About a Fifth Less Likely to Close in Any Given Year Than in the 1980s. The First Year Is Still the Hardest.
Join us Fridays at 12 PM ET to ask TLE CEO Michael Dermer your questions live.
Four decades of Census data say the early years of an employer business have become easier to survive — at every age from one to five, and not as a side effect of a change in who is starting.
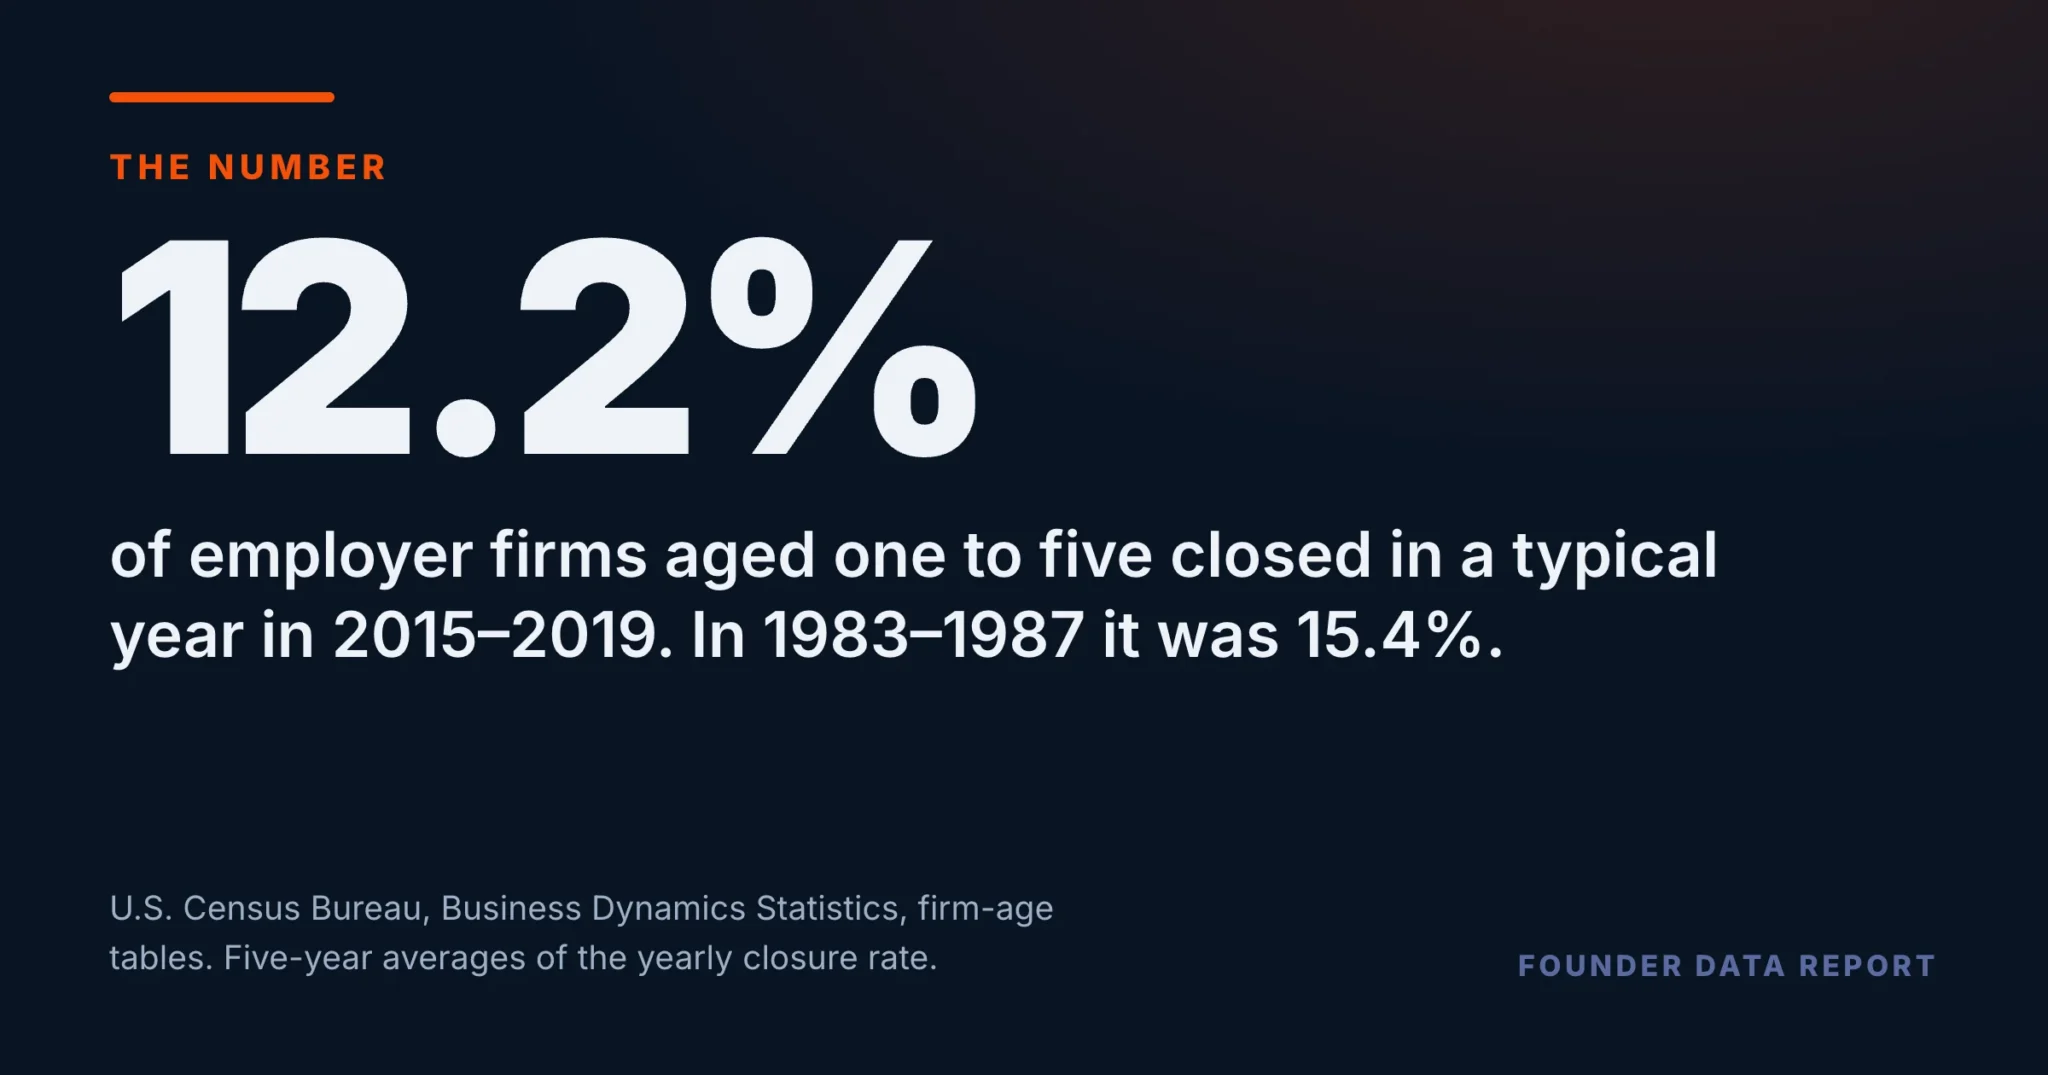
In the five years from 1983 to 1987, an average of 15.4% of American employer firms aged one to five closed each year, according to the Census Bureau’s Business Dynamics Statistics. In 2015 to 2019, before the pandemic, it was 12.2% — about a fifth lower (20%). The fall shows up at every single year of age: first-year closures went from 21.7% to 17.1%, and fifth-year closures from 10.1% to 8.8%. It is not a change in the age mix of young firms; holding that mix at its 1980s shape, the later rate would be 12.4%, not 12.2%. The first year is still the riskiest, by a wide margin.
- Employer firms aged one to five: 15.4% closed a year in 1983–1987, 12.2% in 2015–2019. That is 20% lower.
- Every single year of age improved. In the first year, 21.7% became 17.1%.
- A shift in the age mix explains almost none of it: at the 1980s mix, the later rate is 12.4%.
- Recessions push it back up. The highest year since 1983 was 2009, at 16.2%; the lowest was 2021, at 11.6%.
- The newest year, 2023, reads 14.5%. It is provisional, and this article does not use it as a trend point.
The young-firm closure rate, over four decades
The Business Dynamics Statistics track American employer firms from year to year and record each one’s age. A firm counts as closed when it had employees one March and none the next. Averaged over five-year spans, the share of one-to-five-year-old firms closing each year was above 15% in the first two spans, 1983–1992, eased to 13.3% in 1998–2002, rose to 14.5% across the 2008–2012 span that holds the Great Recession, and fell to 12.2% in 2018–2022. Looking year by year, the rate topped 15% in eight years: six between 1985 and 1991, then 2008 and 2009. It has not done so in any year from 2010 to 2022.
Each bar is the mean of five yearly closure rates. The axis runs from 0% to 18%. 2023, the newest year in the release, is left off as provisional.
U.S. Census Bureau, Business Dynamics Statistics, firm-age tables (BDSFAGE), 1978-2023 release of September 25, 2025, employer firms, United States. Closure rate = firms of that age that closed during the year (March to March), divided by those firms plus the ones still trading. 2023, the release’s newest year, is excluded as provisional.
In the 1980s, about one young employer business in six and a half closed each year. Before the pandemic, it was about one in eight.
Every year of age got easier, not just the average
An average across ages one to five can move on a shift in the mix alone — fewer start-ups would mean fewer first-year firms, which close most often, and a lower average with no change at any age. So each age is checked on its own. All five fell between 1983–1987 and 2015–2019: the first year from 21.7% to 17.1%, the second from 15.4% to 12.2%, the third from 12.6% to 10.5%, the fourth from 11.1% to 9.4%, and the fifth from 10.1% to 8.8%. Recomputing the later rate with the 1980s age mix gives 12.4% — so the mix accounts for less than a tenth of the fall.
Slate is 1983–1987, orange is 2015–2019; the colours name the period. One scale throughout. Each value is the average of five yearly rates.
U.S. Census Bureau, Business Dynamics Statistics, firm-age tables (BDSFAGE), 1978-2023 release of September 25, 2025, employer firms, United States. Closure rate = firms of that age that closed during the year (March to March), divided by those firms plus the ones still trading. 2023, the release’s newest year, is excluded as provisional.
Older firms improved too, but less
The fall is not only a young-firm story. Firms aged six to ten went from 8.8% to 7.2% a year, down 18%. Firms aged eleven to fifteen — measurable only from 1988 — went from 6.8% in 1988–1992 to 5.9%, down 13%. Across all employer firms, the rate went from 9.0% to 7.0%. In relative terms, the one-to-five band improved the most of the three age bands. The data record closures, not causes, and this article does not offer one.
Slate is the earliest five-year span the band can be measured cleanly — 1983–1987, or 1988–1992 for ages 11 to 15 — and orange is 2015–2019. One scale throughout. The all-firms row includes firms older than fifteen.
U.S. Census Bureau, Business Dynamics Statistics, firm-age tables (BDSFAGE), 1978-2023 release of September 25, 2025, employer firms, United States. Closure rate = firms of that age that closed during the year (March to March), divided by those firms plus the ones still trading. 2023, the release’s newest year, is excluded as provisional.
What to do with this if you are in the first five years
The odds are better than they were in the 1980s, and they improve with each year you trade. But they are still steep at the start. Before the pandemic, about 17.1% of first-year employer firms closed within the year, roughly double the 8.8% at age five. Recessions also move the rate: in 2009 it reached 16.2% across ages one to five. The practical reading is to plan for the first two years as the stretch that matters most, and to keep the reserves that let you trade through a bad one.
Four limits worth holding. These are employer firms only — businesses with no employees are not in this data. A closure is a firm going from some employees to none between two Marches, so a firm that keeps trading with no employees counts as a closure here. The rate here divides closures by every firm of that age at the start of the year, not by the survivors. And the newest year, 2023, reads 14.5% for ages one to five, but Census notes that the final year of a release has the least information behind it and that some recorded closures are later reversed when late filings arrive. It is left out of every comparison here.
U.S. Census Bureau, Business Dynamics Statistics, firm-age tables (BDSFAGE), employer firms aged 1 to 5.
Frequently Asked Questions
What share of young businesses close each year?
According to the Census Bureau's Business Dynamics Statistics, 12.2% of employer firms aged one to five closed in a typical year in 2015–2019. In 1983–1987 the figure was 15.4%.
Is it easier to keep a new business open than it used to be?
On this measure, yes. The yearly closure rate fell at every age from one to five between the mid-1980s and the late 2010s. The first-year rate went from 21.7% to 17.1%.
Which year of a business is the riskiest?
The first. In 2015–2019, 17.1% of employer firms closed during their first year of age, against 8.8% at age five.
Do recessions change the closure rate?
Yes. Across ages one to five, the rate peaked at 16.2% in 2009. The lowest year since 1983 was 2021, at 11.6%.
Why is 2023 not included?
It is the newest year in the release, and Census notes the final year has the least information behind it and that some closures are later reversed when late filings arrive. It is reported but not used for comparisons.
Published by The Lonely Entrepreneur — the community and coaching platform for entrepreneurs who are building alone. lonelyentrepreneur.com
This article is for educational purposes and is not a substitute for professional financial or legal advice.