

 Founder Data Report
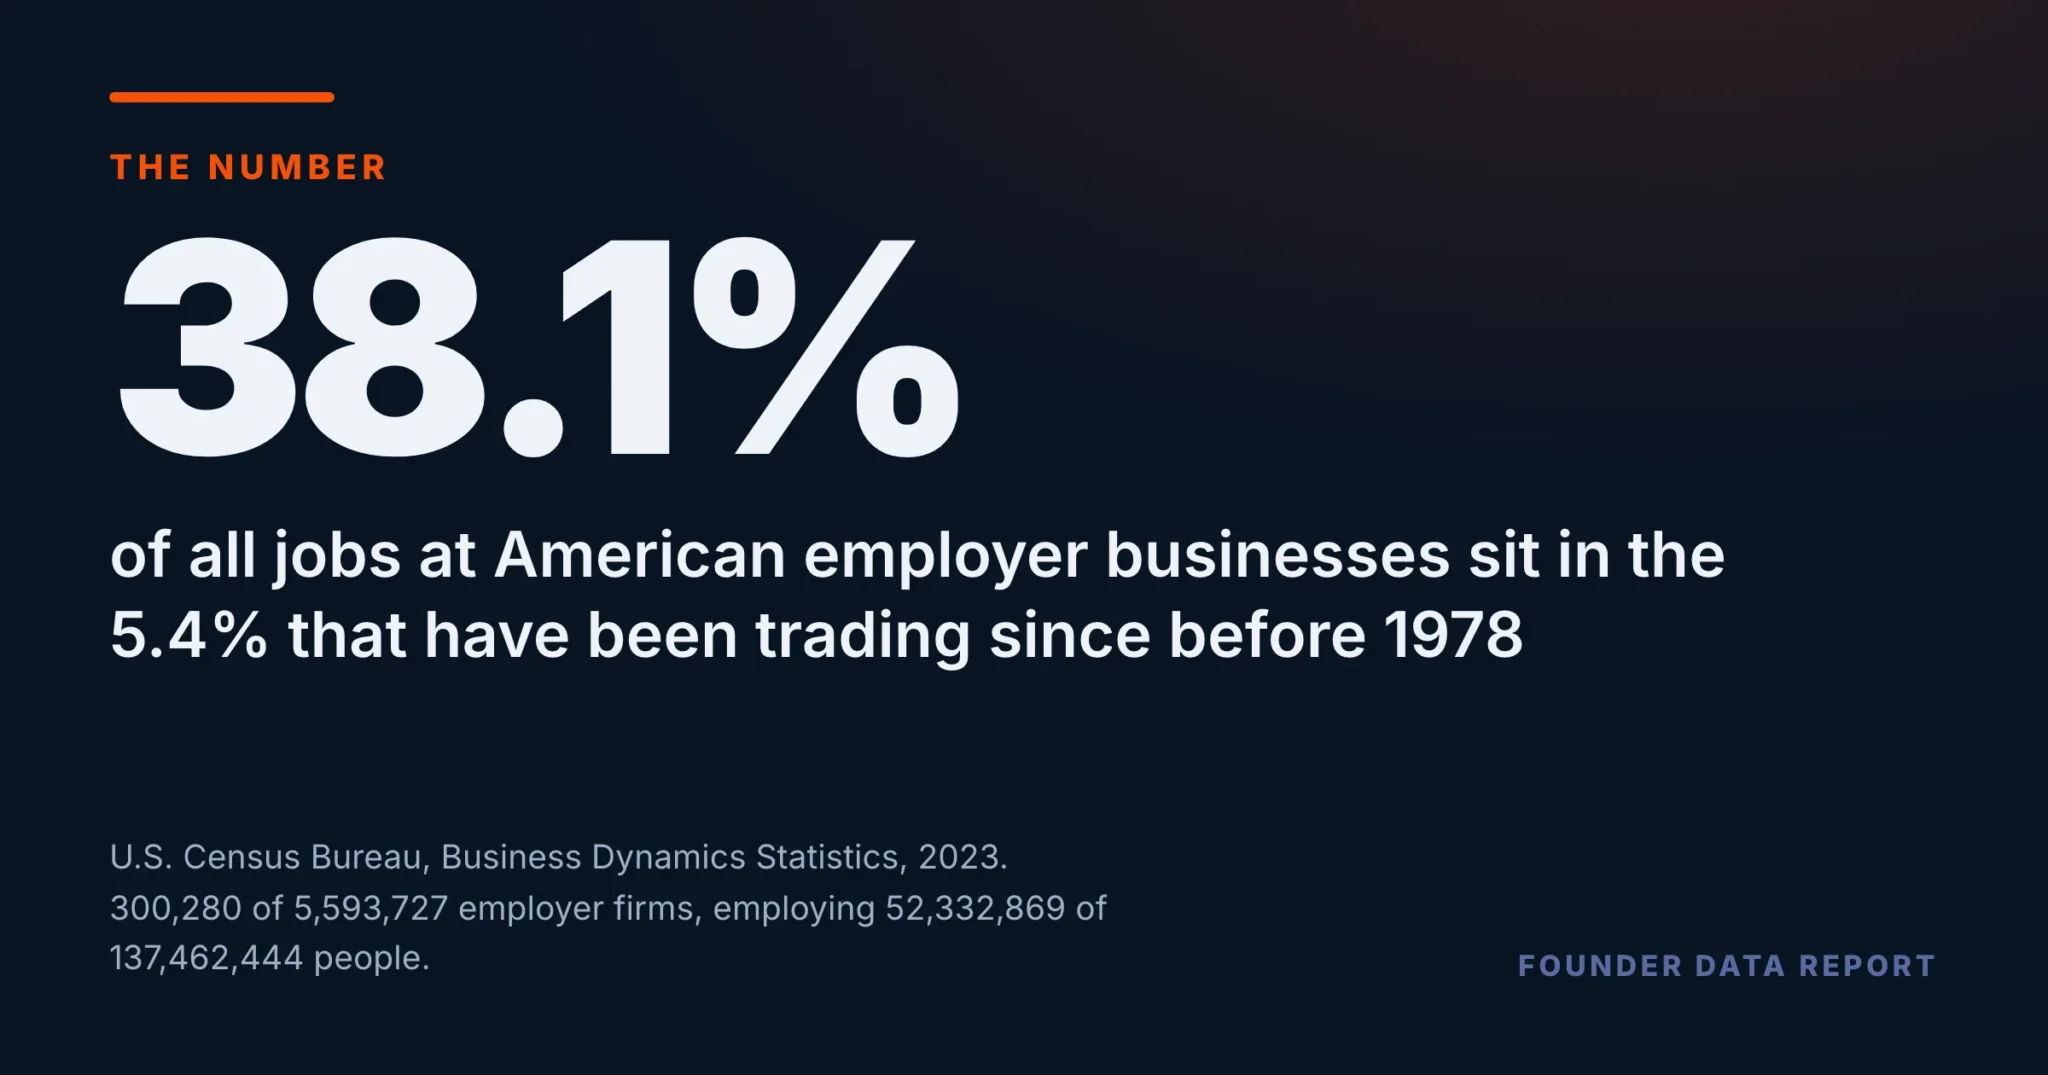
5.4% of American Employer Businesses Have Been Open Since Before 1978. They Hold 38.1% of the Jobs.
You can’t afford to risk your business without a Sidekick at your side.
The Census Bureau has tracked every US employer business by age since 1978. Sorted that way, the businesses and the jobs sit in almost opposite places.
There are 5,593,727 employer businesses in the United States and they employ 137,462,444 people. Sort them by how long they have been open and the two numbers come apart. The 300,280 that have been trading since before 1978 — 5.4% of the businesses — employ 52,332,869 people, 38.1% of the jobs. That is more than the 4,433,985 businesses under twenty-six years old employ between them, which is 51,846,957. 14.8 times as many businesses, 485,912 fewer jobs.
- 300,280 US employer businesses have been trading since before 1978 — 5.4% of all of them. They employ 38.1% of the people.
- Those 300,280 businesses employ 52,332,869 people. The 4,433,985 businesses under twenty-six employ 51,846,957.
- Businesses five years old or younger are 36.2% of the total and hold 10.7% of the jobs.
- The average employer business has 24.6 people. At under a year old it has 4.8; at twenty-six or more, 38.7; before 1978, 174.3.
- Average payroll rises at every single step of the age scale — all eleven steps, with no exception.
Most of the businesses, and not most of the jobs
Age and employment do not line up anywhere on this scale. Businesses five years old or younger are 36.2% of America’s employers — more than a third of them — and hold 10.7% of the jobs. At the other end, everything twenty-six years old or more is 20.7% of the businesses and 62.3% of the jobs. The crossover sits late: only the last two of the seven groups hold a larger share of the jobs than of the businesses. Even the twenty-one-to-twenty-five group is still on the other side of it, at 6.5% of businesses against 6.0% of jobs.
Both bars in a row are drawn on the same 0 to 40% scale, so they can be compared directly, and the printed percentages are the true ones. Slate is the share of businesses and orange the share of jobs; the colours name which measure a bar is, not which number is better. The seven groups are the Bureau’s twelve published age bands folded together — the three youngest are shown as one because under-one-year alone holds 1.8% of the jobs and would draw as a sliver. Each column adds to 100% before rounding and to 100.1% and 100.0% as printed.
U.S. Census Bureau, Business Dynamics Statistics, firm-age tables (BDSFAGE), reference year 2023. Employer firms and their March 2023 employment. ‘Left censored’ means the firm was already trading in 1978, the first year of the series, so it is at least forty-five years old and its exact age is unknown. Firm counts and employment by firm-age band, national total.
14.8 times as many businesses. 485,912 fewer jobs.
Every year open is a bigger payroll
The reason is not that old businesses are numerous. It is that they are bigger, and they get bigger at every step without exception. The average American employer business has 24.6 people on the payroll. Under a year old it has 4.8; at five, 10.2; at eleven to fifteen, 15.3; at twenty-six or more, 38.7. There is no band anywhere on the scale where the average payroll falls back. Whether that is businesses growing as they age, or only the ones that grew surviving to be counted, this file cannot say — it photographs the survivors, it does not follow them.
Bars are drawn on a 0 to 40 axis and the printed figure is the true one. Orange marks a band at or above the national average of 24.6 people. The oldest band is deliberately off this chart: businesses trading since before 1978 average 174.3 people, more than four times the top of the axis, and putting it on would flatten the other eleven bands into slivers.
U.S. Census Bureau, Business Dynamics Statistics, firm-age tables (BDSFAGE), reference year 2023. Employer firms and their March 2023 employment. ‘Left censored’ means the firm was already trading in 1978, the first year of the series, so it is at least forty-five years old and its exact age is unknown. Employment divided by firms within each age band.
Each segment is a share of all 137,462,444 jobs at US employer businesses. The businesses themselves split the other way: 36.2% are five years old or younger, 43.1% are six to twenty-five, and 20.7% are twenty-six or older. So the smallest of the three groups of businesses holds the largest share of the jobs. The youngest group runs the other way round: more than a third of America’s employers are five years old or younger and they hold about a tenth of the work.
U.S. Census Bureau, Business Dynamics Statistics, firm-age tables (BDSFAGE), reference year 2023. Employer firms and their March 2023 employment. ‘Left censored’ means the firm was already trading in 1978, the first year of the series, so it is at least forty-five years old and its exact age is unknown. Employment by firm-age band, grouped.
What the oldest band is, and is not
The Bureau calls that top band ‘left censored’. It means the business was already trading in 1978, the first year of the series, so its exact age is unknown and only its floor is certain: at least forty-five years. It is not a measure of the very oldest companies in America, and it is not a fixed group — it shrinks every year as its members close. The share of firms it accounts for has fallen from more than three quarters in 1978 to 5.4% now, which is why this piece reads the 2023 cross-section and does not chart the band over time.
Nor does any of this say a young business is doing badly. A business under a year old has 4.8 people because it is a year old, not because it failed at something. The useful reading runs the other way: the jobs an economy already has are mostly sitting inside businesses somebody kept open for a long time, and the 4,433,985 businesses under twenty-six — 79.3% of every employer in the country — between them hold 37.7% of the work.
U.S. Census Bureau, Business Dynamics Statistics, firm-age tables (BDSFAGE), reference year 2023. Employer firms and their March 2023 employment. ‘Left censored’ means the firm was already trading in 1978, the first year of the series, so it is at least forty-five years old and its exact age is unknown.
Frequently Asked Questions
How many American businesses have been open since before 1978?
300,280 employer businesses, or 5.4% of the 5,593,727 in the country. They employ 52,332,869 people, which is 38.1% of all employment at US employer businesses.
Do older businesses employ more people than younger ones?
Far more, and at every step. The average US employer business has 24.6 people. Under a year old that is 4.8; at six to ten, 11.8; at twenty-six or more, 38.7; and at the firms trading since before 1978, 174.3. The average payroll does not fall back at any band on the scale.
What share of US jobs are at businesses five years old or younger?
10.7% — at businesses that are 36.2% of all US employers. Young businesses are more than a third of the count and about a tenth of the employment.
What does 'left censored' mean in this data?
It is the Census Bureau's label for a firm that was already trading in 1978, the first year of the series. Its exact founding date is unknown, so the only certain thing is its floor: it is at least forty-five years old. The group shrinks each year as its members close, and it has fallen from most of the business population in 1978 to 5.4% today.
Where do these numbers come from?
The U.S. Census Bureau's Business Dynamics Statistics, firm-age tables, reference year 2023 — firm counts and March employment by age band. Employer businesses only; the self-employed without staff are not counted. The twelve age bands add to the published national totals exactly.
Published by The Lonely Entrepreneur — the community and coaching platform for entrepreneurs who are building alone. lonelyentrepreneur.com
This article is for educational purposes and is not a substitute for professional financial or legal advice.