

 Founder Data Report
The Average American Workplace That Closed Last Year Had Five People on Its Payroll. In Restaurants, Nine.
Join us Fridays at 12 PM ET to ask TLE CEO Michael Dermer your questions live.
The Census Bureau counts every employer business that had staff one March and none the next, and counts the people who were on its payroll. Here is what closing costs, by trade and by how long the business had been open.
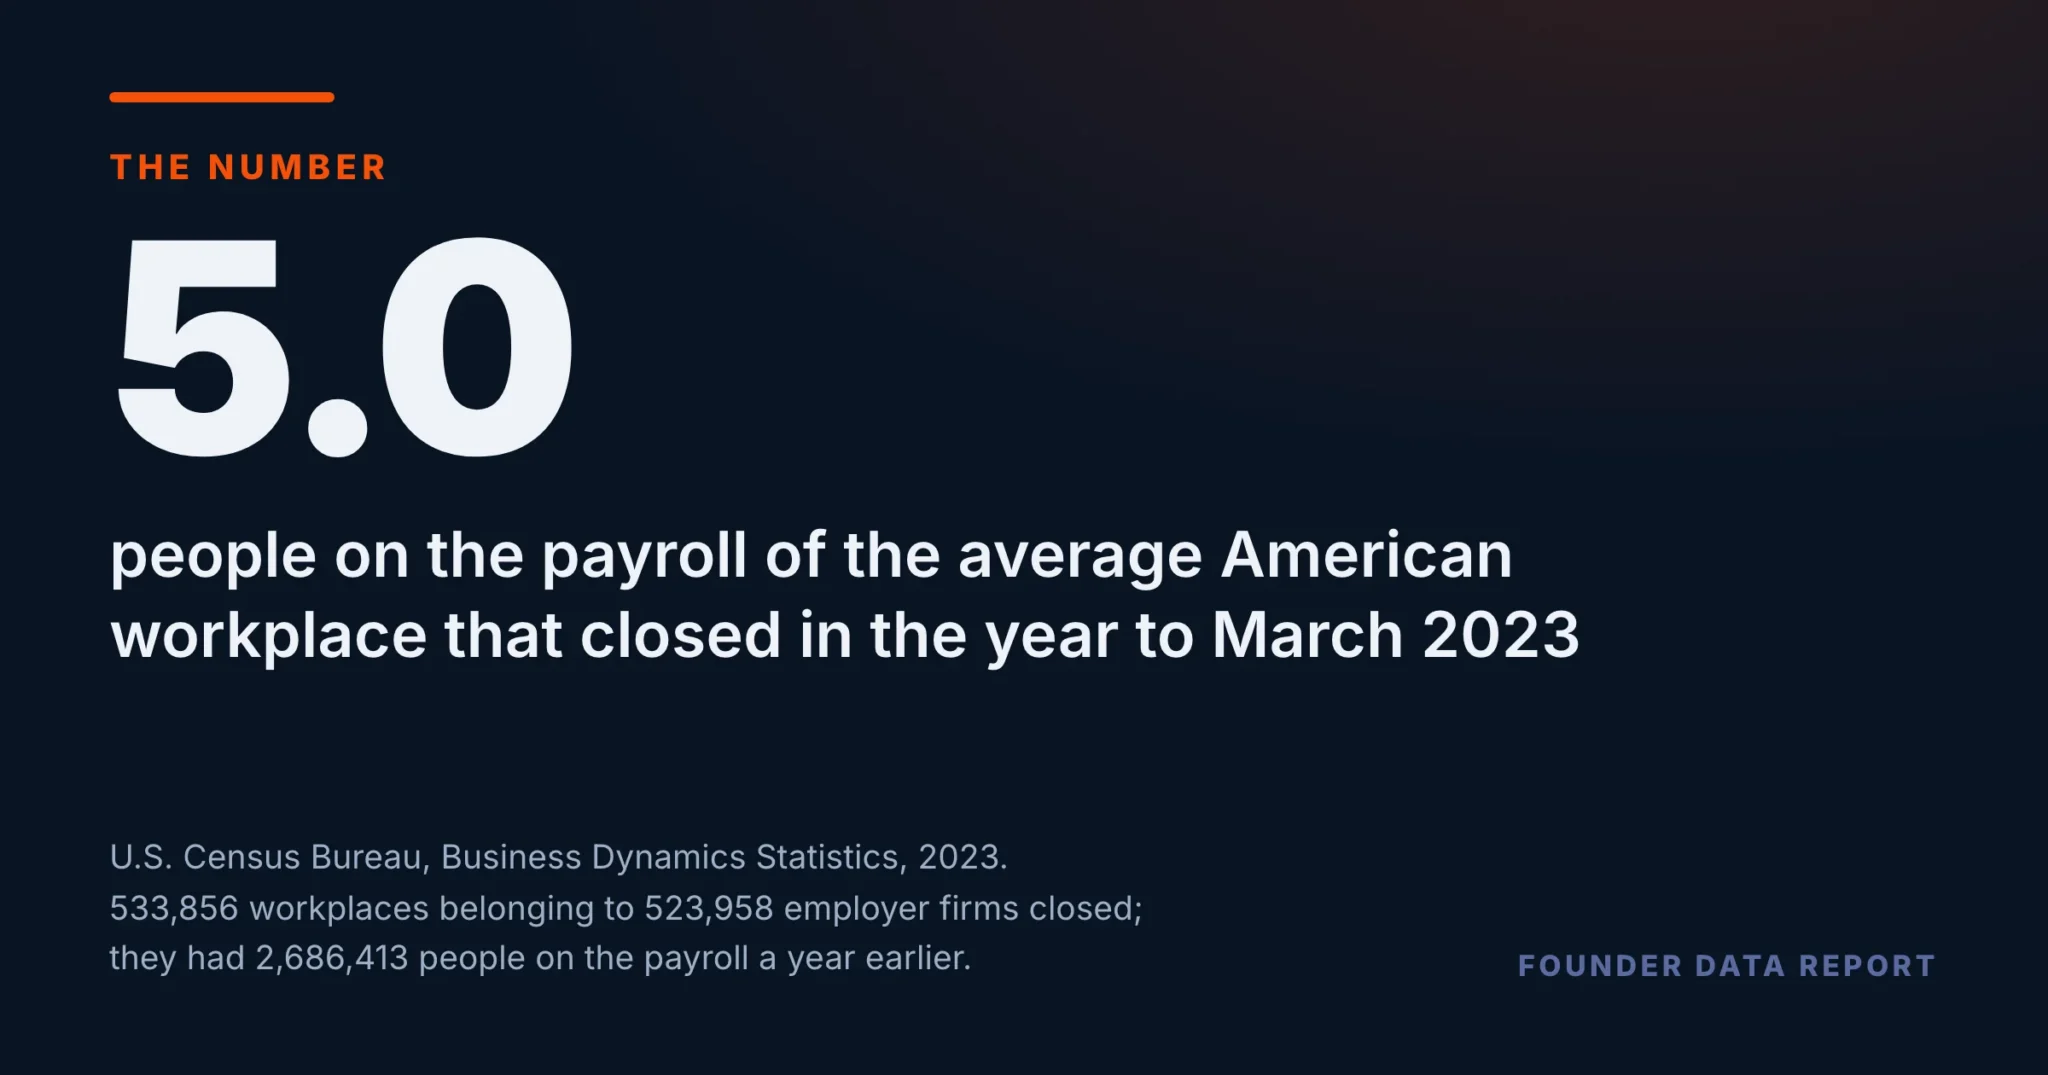
In the year to March 2023, 533,856 American workplaces belonging to 523,958 employer firms stopped having employees. Those workplaces had 2,686,413 people on the payroll twelve months earlier — an average of 5.03 people per closing workplace, or 5.13 per closing firm. The average is not the story. In accommodation and food services it is 8.95; in real estate and rental and leasing it is 2.55. The same closure, in two different trades, is the difference between 3.5 times as many people looking for work.
- 2,686,413 people were on the payroll of the 533,856 US workplaces that closed in the year to March 2023 — 5.03 each.
- Accommodation and food services averaged 8.95 people per closing workplace, the highest of the 15 sectors big enough to read. Real estate averaged 2.55.
- Restaurants and hotels were 10.0% of the closing workplaces and 17.8% of the jobs that went with them.
- A firm that had been open 26 years or more averaged 6.88 people at closing; one closing in its second year averaged 2.95.
- The firms that had been trading since before 1978 averaged 11.32 — 3.8 times the youngest band.
Same closure, very different number of people
A business closing is usually counted one way: how many closed. The Census Bureau’s Business Dynamics Statistics also records how many people were working there, which is the number that decides how much a closure actually costs the people around it. Across the 15 sectors with at least 5,000 closing workplaces — 99.2% of all closures and 99.0% of the employment behind them — the figure runs from 8.95 down to 2.55. Four smaller sectors are left off the chart because their cells are too thin to rank: management of companies posts the highest figure of all at 13.37, on 817 closing workplaces, and one number built on that few units is not a sector reading.
Bars are drawn on a 0 to 10 axis, not 0 to 100, and the printed figure is the true one. Orange marks a sector at or above the national average of 5.03; slate marks the 7 below it. Wholesale trade is the one that decides the line: at 5.06 it clears the average by 0.03 of a person, which is why the figures are printed to two decimals. Four sectors with fewer than 5,000 closing workplaces are excluded — management of companies, mining, utilities and agriculture — which together are 0.8% of closing workplaces.
U.S. Census Bureau, Business Dynamics Statistics, firm-age tables (BDSFAGE), reference year 2023. A firm death is a firm with employees in March 2022 and none in March 2023; the employment counted is what it had in the first of those Marches. Employment divided by closing establishments within each sector.
Where the jobs went, against where the closures were
Because the per-closure figure varies this much, the trades that lose the most businesses are not the trades that lose the most jobs. Professional and technical services had the most closing workplaces of any sector — 14.1% of the national total — but only 10.6% of the employment behind them. Accommodation and food services runs the other way: 10.0% of the closures, 17.8% of the jobs, a gap of 7.8 points and the widest either way. Eight of the 15 sectors carry a larger share of the jobs than of the closures and seven carry less, though wholesale trade clears by 0.02 of a point and is a tie in all but sign.
Both bars in a row are drawn on the same 0 to 20% scale, so they can be compared directly, and the printed percentages are the true ones. Each is a share of the national total — 533,856 closing workplaces and 2,686,413 people. Slate is the share of closures and orange the share of the jobs; the colours name which measure a bar is, not which number is better — in three of these six rows the orange bar is the shorter one. Six of the 15 charted sectors are shown: the three with the largest excess of jobs over closures and the three with the largest shortfall.
U.S. Census Bureau, Business Dynamics Statistics, firm-age tables (BDSFAGE), reference year 2023. A firm death is a firm with employees in March 2022 and none in March 2023; the employment counted is what it had in the first of those Marches. Shares of the national closing-establishment and closing-employment totals.
10.0% of the closures. 17.8% of the people.
The longer it had been open, the more people went with it
The same file records how old each closing firm was. A firm that closed in its second year had 2.95 people on the payroll. One that had been trading twenty-six years or more had 6.88, and the 13,422 firms that had been in business since before 1978 — at least forty-five years old — had 11.32. The figure climbs at almost every step of the age scale; the one exception is the sixteen-to-twenty band, which sits just below eleven-to-fifteen. Nothing here says an older business is more likely to close. It says that when one does, more people are standing behind it.
Bars are drawn on a 0 to 12 axis and the printed figure is the true one. Orange marks a band at or above the national average of 5.13 people per closing firm. There is no bar for firms under one year old: a business cannot be recorded as closing before its first birthday, and the Bureau flags that cell rather than printing a zero. The eleven bands shown add to all 523,958 closing firms and all 2,686,413 people.
U.S. Census Bureau, Business Dynamics Statistics, firm-age tables (BDSFAGE), reference year 2023. A firm death is a firm with employees in March 2022 and none in March 2023; the employment counted is what it had in the first of those Marches. Employment divided by closing firms within each age band.
What this does not measure
It does not say 2,686,413 people were made redundant. The Bureau counts the employment a firm had in the March before it stopped having any, so the figure includes people who had already left, and it cannot see anyone hired by a buyer, a successor or a competitor down the road. It is the size of the payroll that stopped being that firm’s, not a count of people out of work.
One counting note sits underneath the sector chart. A firm operating in two industries is recorded as a closure in both, so the nineteen sectors’ firm counts add to 524,877 against a national 523,958 — an over-count of 919, or 0.175%. Workplaces and employment carry no such overlap: both add to the national total exactly. That is why every sector figure on this page is per closing workplace, and only the national and age figures are per closing firm.
U.S. Census Bureau, Business Dynamics Statistics, firm-age tables (BDSFAGE), reference year 2023. A firm death is a firm with employees in March 2022 and none in March 2023; the employment counted is what it had in the first of those Marches.
Frequently Asked Questions
How many people were on the payroll of the average US business that closed in 2023?
5.03 per closing workplace and 5.13 per closing firm. 533,856 workplaces belonging to 523,958 employer firms closed in the year to March 2023, and they had 2,686,413 people on the payroll a year earlier.
Which industry loses the most people per business closure?
Of the 15 sectors with enough closing workplaces to read, accommodation and food services is highest at 8.95 people per closing workplace, and real estate and rental and leasing is lowest at 2.55. Management of companies posts a higher figure still, 13.37, but on only 817 closing workplaces, which is too thin to rank.
Do older businesses employ more people when they close?
Yes. A firm closing in its second year averaged 2.95 people; one that had been trading twenty-six years or more averaged 6.88, and firms open since before 1978 averaged 11.32. This is not a statement about how likely each is to close — only about how many people are behind it when it does.
Does this mean 2.69 million people lost their jobs?
No. The figure is the employment each firm had in the March before it stopped having any. It includes people who had already left and it cannot follow anyone picked up by a buyer or a competitor. It measures the size of the payroll that ended, not unemployment.
Where do these numbers come from?
The U.S. Census Bureau's Business Dynamics Statistics, firm-age tables, reference year 2023 — the Bureau's own count of employer firms that had staff one March and none the next, with the employment they carried. Employer businesses only; the self-employed without staff are not in it.
Published by The Lonely Entrepreneur — the community and coaching platform for entrepreneurs who are building alone. lonelyentrepreneur.com
This article is for educational purposes and is not a substitute for professional financial or legal advice.