

 Founder Data Report
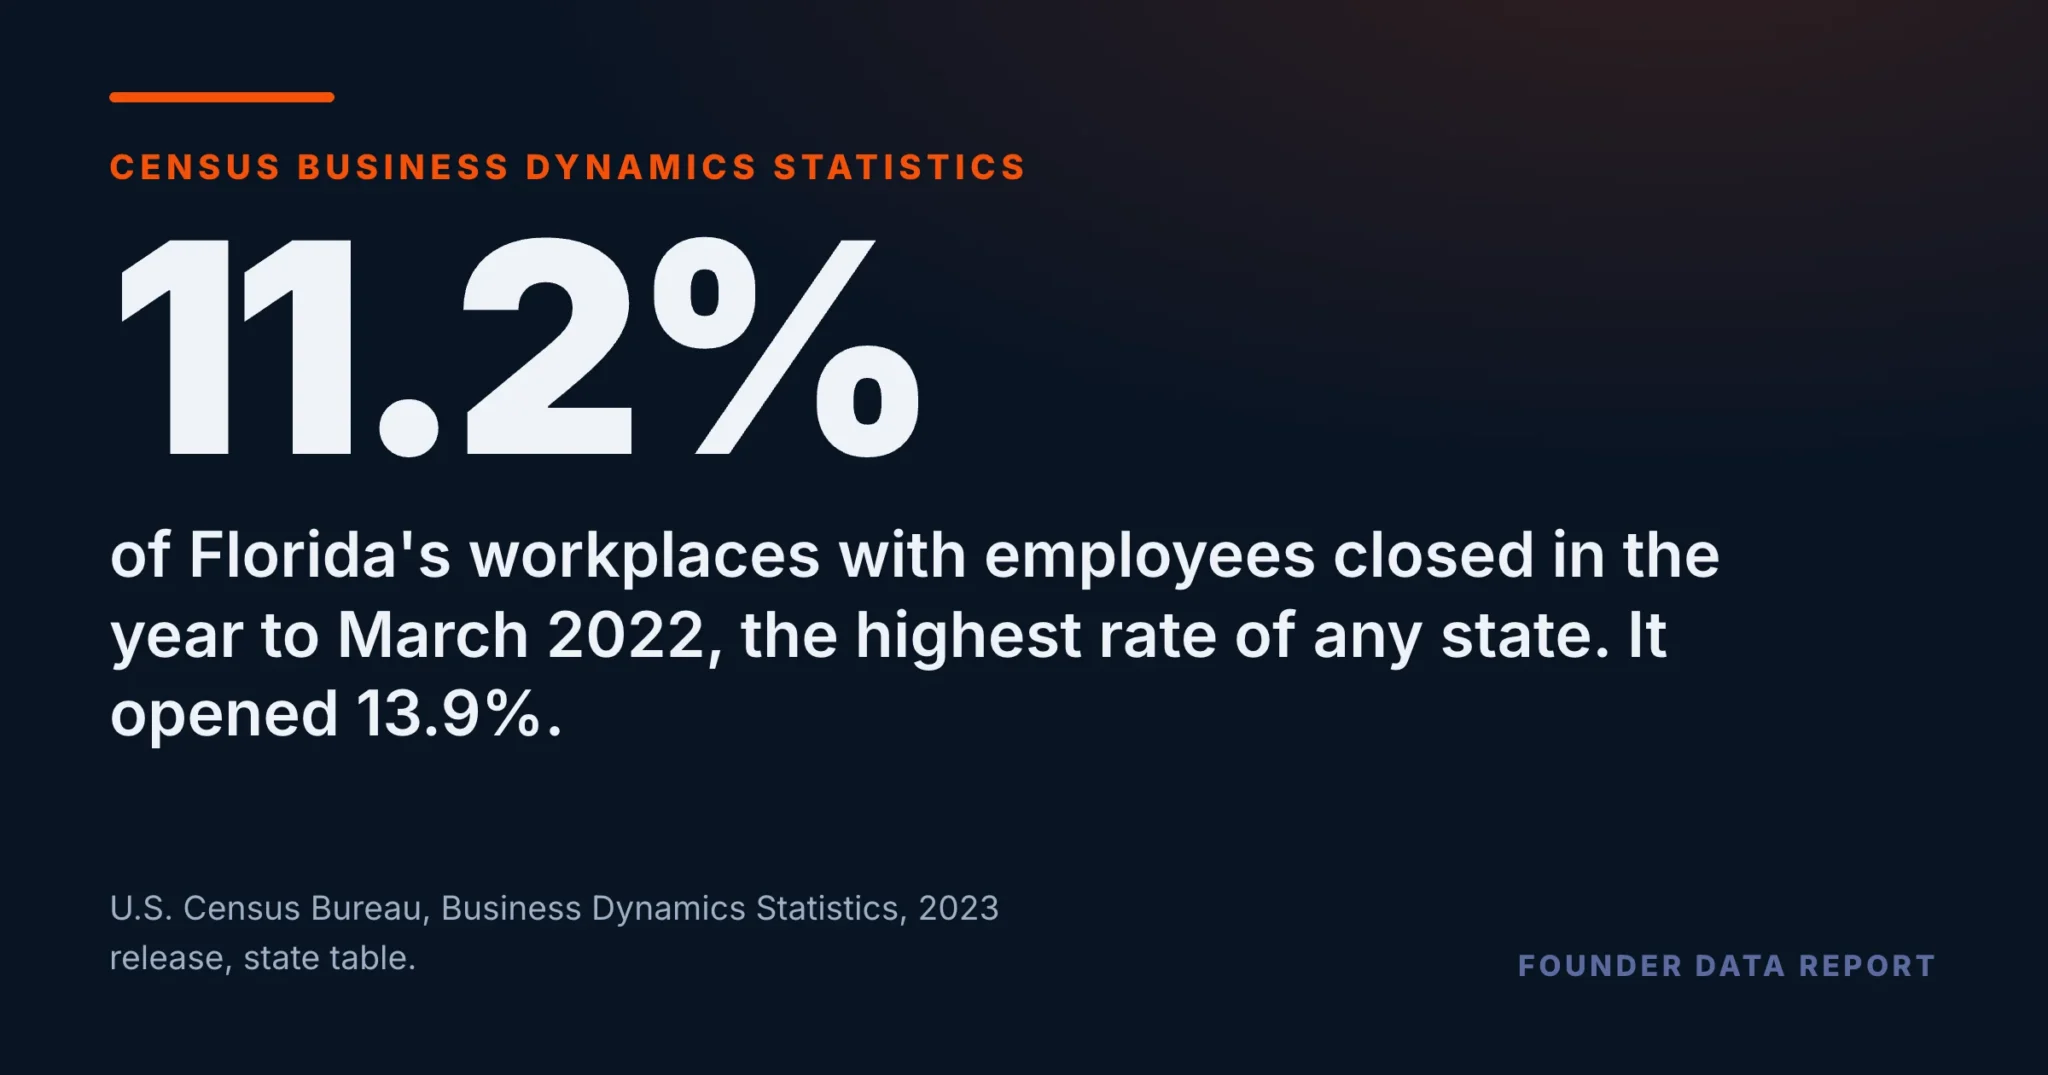
In the Year to March 2022, Florida Closed 11.2% of Its Workplaces, the Most of Any State. It Opened 13.9%
You can’t afford to risk your business without a Sidekick at your side.
Census counts every workplace with a payroll, every year. The states with the highest closure rates tend to be the states with the highest opening rates, and they have been in every year since 1979.
In the U.S. Census Bureau’s Business Dynamics Statistics, 11.2% of Florida’s workplaces with employees closed in the year to March 2022, the highest rate of any state, with Colorado a hair behind. Florida also opened new workplaces at a rate of 13.9%, second only to Nevada. That was not a one-state quirk. Across the 50 states and DC, states with higher closure rates tended to have higher opening rates, and that link has held in every year of the data since 1979.
- Nationally, 9.5% of workplaces with employees closed in the year to March 2022, and 11.7% opened.
- Florida’s closure rate was the highest of any state, 11.2%. Its opening rate was 13.9%.
- South Dakota had the lowest closure rate, 7.7%, and opened 9.9%.
- The 10 states with the highest closure rates opened 13.2% new workplaces. The 10 with the lowest opened 9.8%.
- In the year to March 2009, closures outnumbered openings in 50 of 51. In the year to March 2022: none.
What the count covers
The Business Dynamics Statistics are built from the Census Bureau’s register of every business with paid employees. A workplace here is an establishment: one physical location, a shop, an office, a plant, a restaurant. It counts as closed when it had employees one March and none the next, and as opened when it had none one March and employees the next. Each year in the data runs from March to March. A location sits in exactly one state, so establishments can be added up state by state, and the 51 state rows sum exactly to the national total.
In the year to March 2022, about 697,000 workplaces closed nationwide, 9.5% of the total, and about 854,000 opened, 11.7%. In Florida, 61,219 closed and 76,030 opened. That closure rate, 11.2%, was the highest of any state; Colorado’s was within a tenth of a point. At the other end, South Dakota closed 7.7%, Pennsylvania 8.1% and Nebraska 8.2%. Every one of the 51 opened more workplaces than it closed that year.
Establishments with paid employees. Closed: had employees in March 2021 and none in March 2022. Opened: the reverse. Rates are per 100 workplaces. All bars on one scale, 0 to 15%. The top five states by closure rate are listed first, then the bottom five. Florida (11.21%) and Colorado (11.16%) round to the same figure.
U.S. Census Bureau, Business Dynamics Statistics, 2023 release, state table (bds2023_st) and national table; establishment entry and exit rates, years running March to March; retrieved from www2.census.gov on October 25, 2026.
The states that close fastest open fastest
Sort the states by how fast their workplaces closed in the year to March 2022 and split them into five groups. The 10 with the highest closure rates, 10.8% together, also opened the most: 13.2%. Each group down the list opened at a lower rate, until the 10 states with the lowest closure rates, 8.3% together, opened 9.8%. Eight of the 10 states with the highest closure rates were also among the 10 with the highest opening rates.
States sorted by establishment closure rate, then grouped. Each group’s rates are pooled across its states, so a large state counts for more. Bars show the opening rate on a 0 to 15% scale. Orange: the highest and lowest groups.
U.S. Census Bureau, Business Dynamics Statistics, 2023 release, state table (bds2023_st) and national table; establishment entry and exit rates, years running March to March; retrieved from www2.census.gov on October 25, 2026.
This is the normal shape of the data, not a feature of one year. In every year from 1979 to 2022, states with higher closure rates tended to have higher opening rates too. Florida is the steadiest example. In the 18 years to March 2005 through March 2022, it had the highest closure rate of any state 10 times and was never lower than third, except in the year to March 2021, when it was ninth. In all 18 it ranked in the top five for openings, and in 16 it was in the top three.
The states with the highest closure rates tend to be the states with the highest opening rates.
The years when closures won
There are years when closures outnumber openings almost everywhere. In the year to March 2009, 11.6% of workplaces nationwide closed and 9.3% opened, and closures outnumbered openings in 50 of the 51. By the year to March 2015 that was down to 2. In the year to March 2021 it was 15, and in the year to March 2022, 0. The records count what happened. They do not say why.
Count of the 51 (50 states and DC) where establishment closures exceeded openings in the year ending in March. The axis runs from 0 to 52.
U.S. Census Bureau, Business Dynamics Statistics, 2023 release, state table (bds2023_st) and national table; establishment entry and exit rates, years running March to March; retrieved from www2.census.gov on October 25, 2026.
What to take from this if you run a small one
A high closure rate around you is not, on its own, a sign of a market that is failing. In these records it travels with a high opening rate: the states with the highest closure rates tend to have the highest opening rates too. That is a market with a lot of movement in it, and movement cuts both ways. A larger share of the field is new each year, and a larger share is gone. If you are in one of the high-turnover states, plan as if the field will look different in a year. In Florida, by this count, more than one workplace in ten closed within the year, and about one in seven was new.
Three limits worth holding. These are workplaces, not companies: a chain that shuts one location and opens another shows up as one closure and one opening. The records do not say why a workplace closed, or whether its owner moved, sold, retired or failed. And they cover only places with paid employees; businesses run by the owner alone are outside the count. The latest year Census has published, to March 2023, is provisional and is left out here.
U.S. Census Bureau, Business Dynamics Statistics, 2023 release.
Frequently Asked Questions
Which state has the highest business closure rate?
In the Census Bureau's Business Dynamics Statistics, Florida had the highest closure rate for workplaces with employees in the year to March 2022: 11.2%. Colorado was within a tenth of a point.
Do states with higher closure rates also open more new workplaces?
Yes, in these records. The 10 states with the highest closure rates opened new workplaces at 13.2% in the year to March 2022; the 10 with the lowest opened 9.8%. The link has held in every year since 1979.
How many workplaces close in the US each year?
In the year to March 2022, about 697,000 workplaces with employees closed, 9.5% of the total, while about 854,000 opened.
When did closures outnumber openings in the most states?
In the year to March 2009, closures outnumbered openings in 50 of the 50 states and DC. They outnumbered openings in more than half the states in every year to March 2008 through March 2011, and again in the year to March 2020. In the year to March 2022, they did in none.
Where does the data come from?
The U.S. Census Bureau's Business Dynamics Statistics, 2023 release, state and national tables. It covers establishments with paid employees, counted each March.
Published by The Lonely Entrepreneur — the community and coaching platform for entrepreneurs who are building alone. lonelyentrepreneur.com
This article is for educational purposes and is not a substitute for professional financial or legal advice.