

 Founder Data Report
Weather Losses Hit Accommodation and Food Service Almost Six Times as Often as Professional Services
Join us Fridays at 12 PM ET to ask TLE CEO Michael Dermer your questions live.
A year of Census survey rounds, split by trade, shows the same trade near the top of the weather-loss table in every round — and one trade that swings from near the bottom to second.
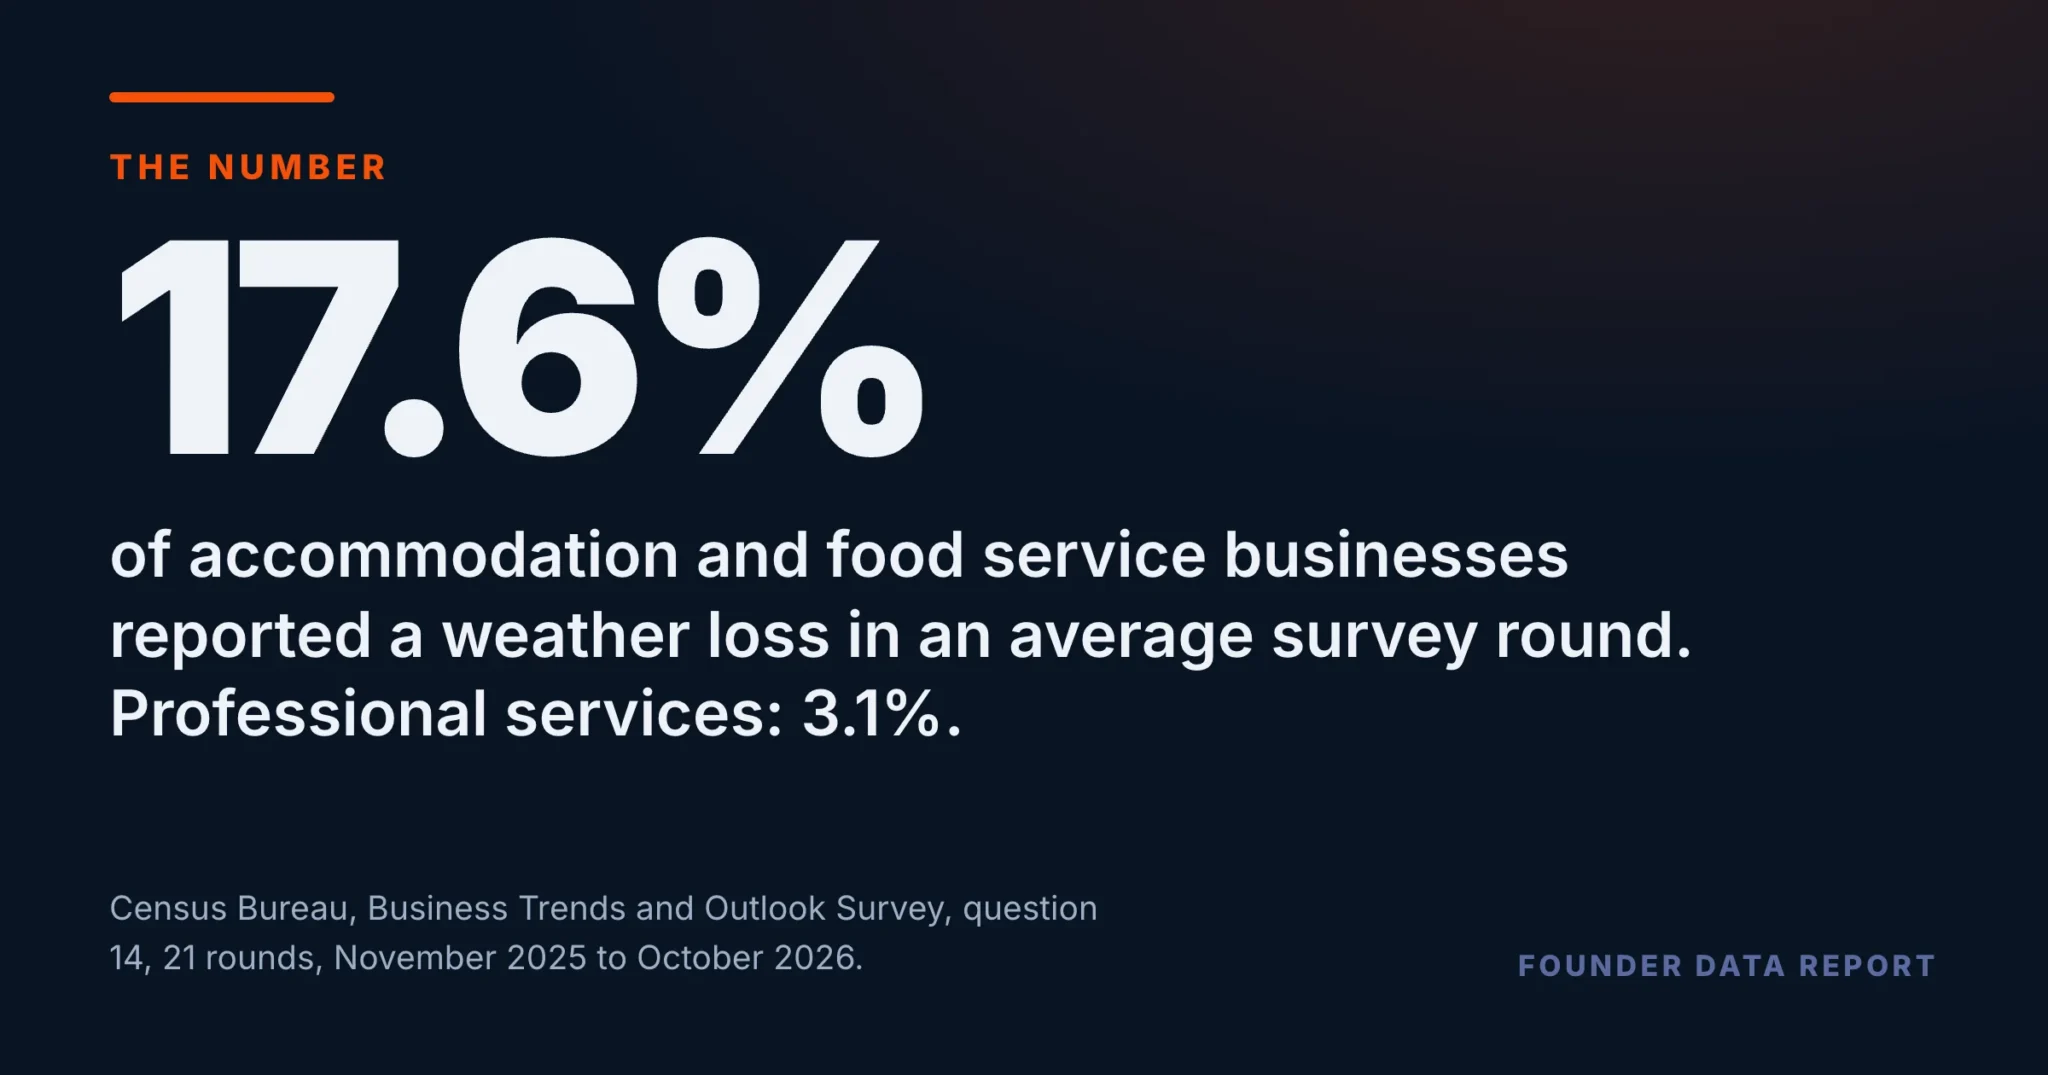
Across the 21 rounds of the Census Bureau’s Business Trends and Outlook Survey collected between November 2025 and October 2026, an average of 17.6% of accommodation and food service businesses said they had lost money to an extreme weather event in the previous six months. For professional, scientific and technical services the average was 3.1% — almost six times less often. Accommodation and food services ranked first or second of 16 trades in every one of the 21 rounds, sharing the top with agriculture. Professional services ranked 14th or lower in every round. Health care swung from 13th in late November 2025 to second in mid-February 2026.
- Weather losses in the past six months, average of 21 rounds: accommodation and food services 17.6%, agriculture 15.1%, all businesses 8.4%, professional services 3.1%.
- Accommodation and food services was first or second in all 21 rounds. Its lowest round (8.2%) was above professional services’ highest (6.5%).
- Agriculture and accommodation and food services are statistically level in most rounds. Finance and professional services are level at the bottom in most rounds.
- Health care went from 2.1% in late November 2025 to 20.9% in mid-February 2026, from 13th to second.
- The survey records that a loss happened, not what caused it. This article does not guess.
The trades at the top, and how far apart they sit
Every two weeks the Census Bureau asks a large sample of employer businesses whether, in the last six months, they lost money because of an extreme weather event such as a hurricane, flood, drought or heat wave. Across all businesses the answer averaged 8.4% over the past year’s rounds. Split by trade, the range runs from 3.1% to 17.6%. Eight of the 16 trades sit above the all-business figure. At the top are accommodation and food services (17.6%) and agriculture, forestry and fishing (15.1%), followed by retail trade (11.6%). At the bottom are finance and insurance (3.4%) and professional, scientific and technical services (3.1%).
Each bar runs from zero to the trade’s highest round; the white tick marks its 21-round average. Bars are drawn on a 0% to 35% scale.
Mining, utilities and management of companies are left out because most of their rounds are suppressed. Businesses operating in more than one sector are also left out.
U.S. Census Bureau, Business Trends and Outlook Survey (BTOS), Sector.xlsx and National.xlsx, question 14, the 21 rounds collected November 17, 2025 to October 4, 2026 in which all 16 sectors shown are published; files dated October 6, 2026, retrieved from census.gov on October 9, 2026.
One trade sat in the top two for weather losses in every round. For a business in it, a weather loss is a recurring cost, not a stroke of bad luck.
The top and the bottom held in every round
Averages can hide a lot, so the ranking was checked round by round. Accommodation and food services was first in 12 of the 21 rounds and second in the other 9. Agriculture was in the top three in 16 rounds and retail in 11. Professional services was never higher than 14th. The gap at each end is wide: accommodation and food services’ lowest round, 8.2%, was above professional services’ highest, 6.5%. Two closer comparisons do not separate. Accommodation and food services and agriculture clear each other’s margin of error in only 4 of the 21 rounds, so they share the top. Finance and professional services separate in only 2, so they share the bottom. One caution: each round asks about the previous six months, so neighbouring rounds overlap and 21 rounds are not 21 separate pieces of evidence.
Orange marks accommodation and food services, the only trade in the top three in every round. Ranks are among the 16 trades shown in the first chart.
U.S. Census Bureau, Business Trends and Outlook Survey (BTOS), Sector.xlsx and National.xlsx, question 14, the 21 rounds collected November 17, 2025 to October 4, 2026 in which all 16 sectors shown are published; files dated October 6, 2026, retrieved from census.gov on October 9, 2026.
The trade that went from 13th to second
Health care and social assistance averaged 10.1% across the year, close to the middle. That average hides the widest swing of any trade except accommodation and food services. In the round collected in late November 2025 it reported 2.1%, 13th of 16. In the round collected in mid-February 2026 it reported 20.9%, second only to accommodation and food services, and it was second again in the round collected in early May. Other services (repair, personal care and the like) followed the same path, from 3.8% to 20.5%. Professional services rose too, from 1.1% to 6.1%, and stayed in the bottom three.
Slate is the round collected November 17–30, 2025; orange is the round collected February 9–22, 2026. Bars are drawn on a 0% to 35% scale.
U.S. Census Bureau, Business Trends and Outlook Survey (BTOS), Sector.xlsx and National.xlsx, question 14, the 21 rounds collected November 17, 2025 to October 4, 2026 in which all 16 sectors shown are published; files dated October 6, 2026, retrieved from census.gov on October 9, 2026.
What to take from this if you run one of these businesses
If your trade sits at the top of this table, a weather loss is not a rare event to be surprised by. In accommodation and food services, roughly one business in six reported one in an average round, and in the worst round nearly one in three did. That is a planning number: it belongs in the cash reserve, the supplier list and the conversation with your insurer before the season that hits your trade, not after it. If you run a health care or personal-service business, the useful reading is the swing. A quiet autumn says little about February. If you run a professional firm, the risk in this table is low but not zero.
Four limits worth holding. The survey covers employer businesses, not one-person operations. It records that a business lost money to weather, not how much or why. The figures are estimates from a sample, and two trades are only treated as different here when the gap clears both margins of error. And because each round looks back six months, neighbouring rounds share most of their window.
U.S. Census Bureau, Business Trends and Outlook Survey, question 14, by sector.
Frequently Asked Questions
Which businesses lose money to extreme weather most often?
Accommodation and food services (17.6%) and agriculture, forestry and fishing (15.1%), on average across 21 rounds of the Census Bureau's Business Trends and Outlook Survey from November 2025 to October 2026.
Which businesses report weather losses least often?
Professional, scientific and technical services (3.1%) and finance and insurance (3.4%). Professional services ranked 14th or lower of 16 trades in every round.
How many businesses overall reported a weather loss?
An average of 8.4% of employer businesses across the same 21 rounds said they had lost money to an extreme weather event in the previous six months.
Does the ranking change through the year?
At the top and bottom, no. Accommodation and food services was first or second in every round. In the middle it does: health care went from 13th in late November 2025 to second in mid-February 2026.
Does the survey say what caused the losses?
No. The question asks whether a business lost money because of an extreme weather event, with examples, but this table does not record the cause or the size of the loss.
Published by The Lonely Entrepreneur — the community and coaching platform for entrepreneurs who are building alone. lonelyentrepreneur.com
This article is for educational purposes and is not a substitute for professional financial or legal advice.