

 Founder Data Report
Solo Businesses Shook Off 2020 in a Year. 2023 Took Six Times the Hit.
You can’t afford to risk your business without a Sidekick at your side.
Eleven years of IRS Schedule C tables show the pandemic shock to solo-business profits was steep and short. What came after it was slower, and by 2023 it had cost more.
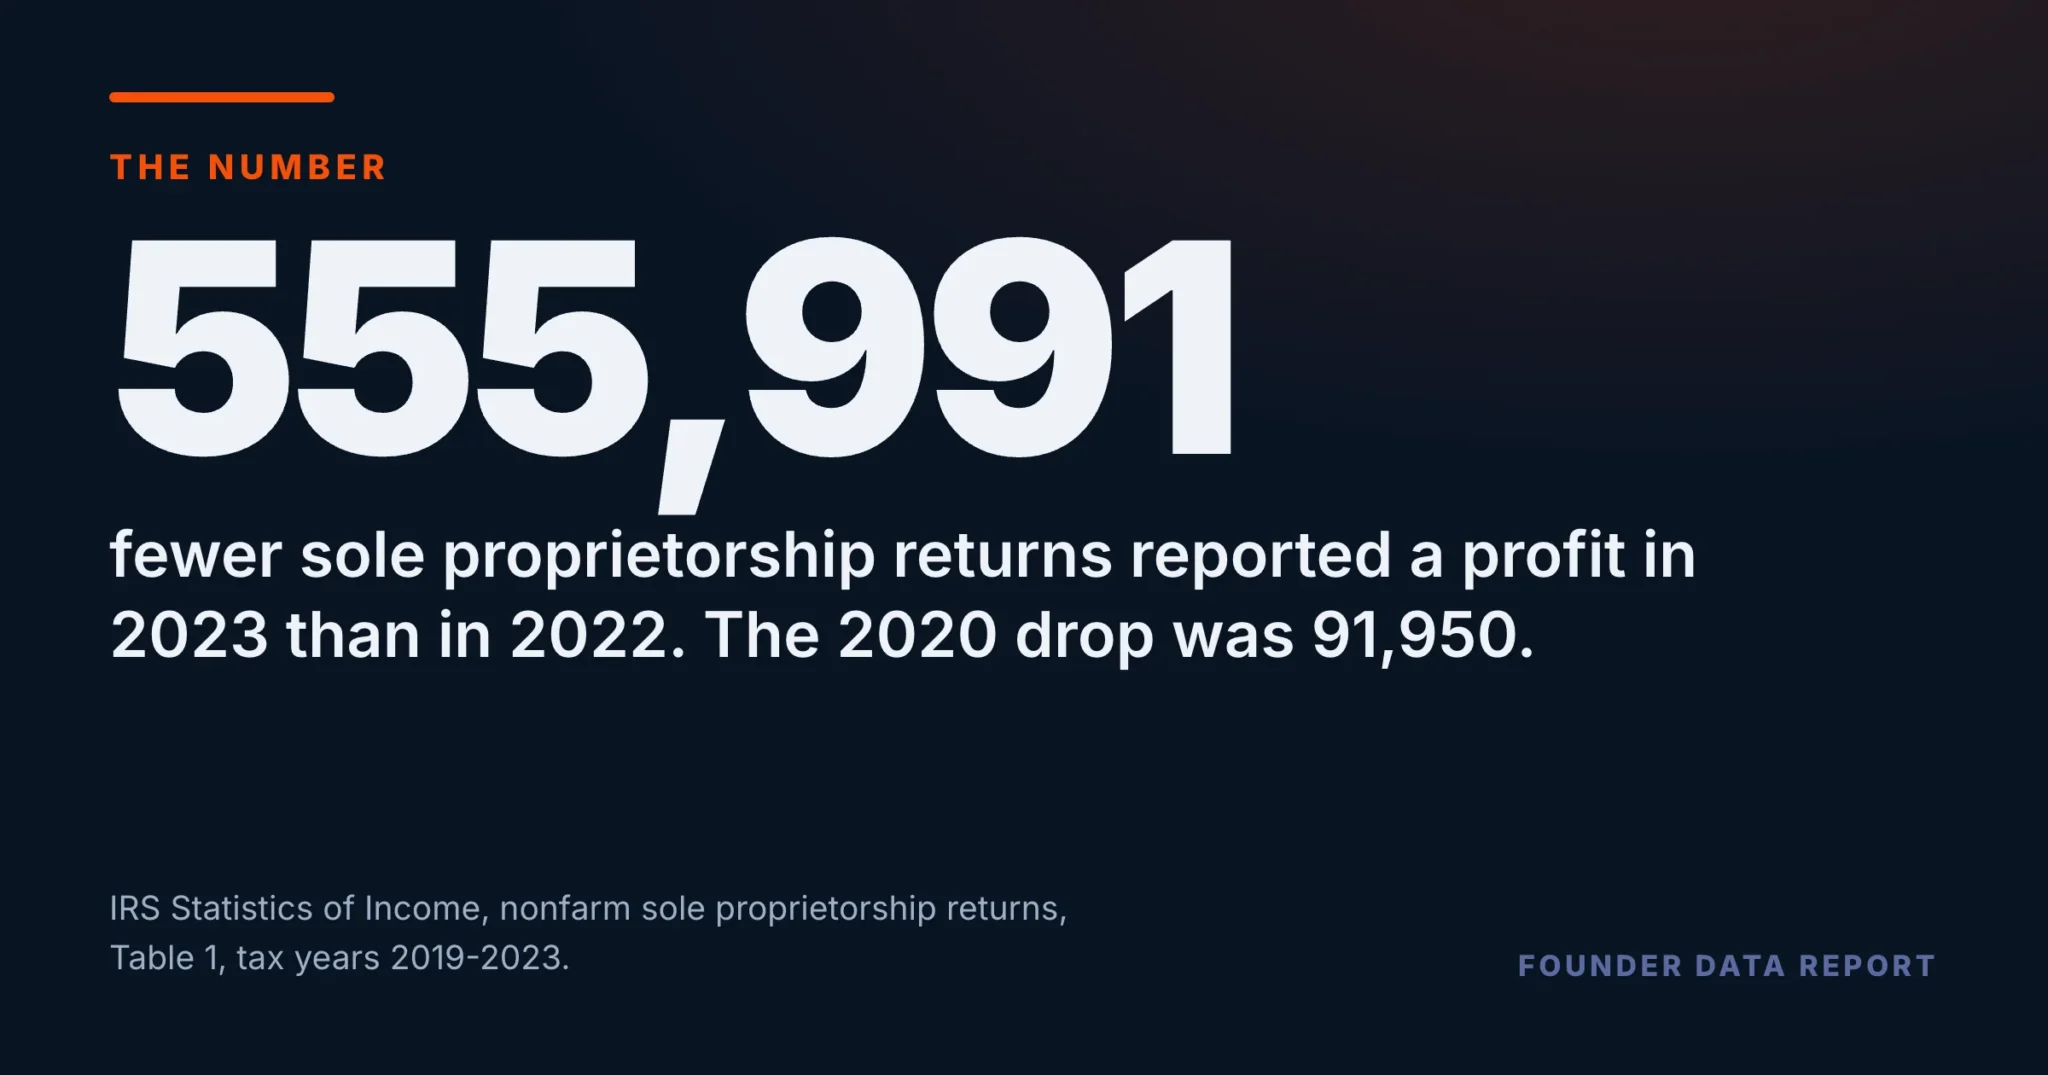
The number of American sole proprietorship returns reporting a profit fell in only two of the ten years from 2013 to 2023, according to IRS Statistics of Income tables. In 2020 it fell by 91,950, and in 2021 it rose by 1,125,202 — the biggest gain of the decade. In 2023 it fell by 555,991, about six times the 2020 drop. The six industries hit hardest in 2020 each won back more than half of their loss within a year. By 2023, the share of returns reporting a profit was 68.8%, below the 70.5% of 2020 and the lowest in the eleven years.
- Returns reporting a profit: down 91,950 in 2020, up 1,125,202 in 2021, down 555,991 in 2023.
- The share reporting a profit went 72.1% → 70.5% → 72.0% from 2019 to 2021. In 2023 it was 68.8%.
- Six industries lost three points or more in 2020. All six got back more than half of it in 2021; manufacturing and information finished above 2019.
- By 2023, 9 of 16 industries sat more than a point below their own 2020 level. Real estate, barely touched in 2020, was 8.2 points below it.
- The table records results, not reasons. This article does not offer one.
The two years the profitable count fell
Every year, the IRS publishes a table of nonfarm sole proprietorship returns — the Schedule C filed by people who run a business on their own account — split into all returns and returns with net income. Subtract one year’s profitable count from the next and the decade reads as steady growth with two breaks. In 2020 the number reporting a profit fell by 91,950, from 20,068,698 to 19,976,748, while the total number of returns kept rising. In 2021 it jumped by 1,125,202, the largest gain in the series. The second break is 2023: down 555,991, to 21,411,462. Between 2020 and 2023 the count of returns without a profit rose from 8,376,619 to 9,714,447.
Each bar is one year’s count minus the year before. Bars to the left are falls. The axis runs to 1.2 million in each direction.
IRS, Statistics of Income, Nonfarm Sole Proprietorship Returns, Table 1, tax years 2013-2023 (files 13sp01br.xls through 23sp01br.xls), retrieved from irs.gov on September 17, 2026. Share = returns with net income divided by all returns.
The shock everyone remembers was over in a year. The one that followed had no name, and it took more.
Where 2020 landed, and how fast it came back
The 2020 drop was not spread evenly. Across the 16 industries with enough returns to read, 11 saw their profitable share fall by a point or more, and six fell by three points or more: information, arts and entertainment, wholesale trade, food service and accommodation, manufacturing, and other services (repair, personal care and the like). Those six fell 5.6 points on average. Retail trade was the one industry whose share rose by more than a point that year. The recovery was fast. In 2021, the six hard-hit industries gained back 5.1 points on average. Every one of them recovered more than half of its loss within the year, and manufacturing and information ended 2021 above where they had been in 2019.
Slate is 2019, red is 2020, orange is 2021. Each bar is drawn on a 0% to 100% scale. Hardest hit means the share fell three points or more in 2020.
IRS, Statistics of Income, Nonfarm Sole Proprietorship Returns, Table 1, tax years 2013-2023 (files 13sp01br.xls through 23sp01br.xls), retrieved from irs.gov on September 17, 2026. Share = returns with net income divided by all returns.
2023, measured against each industry’s own 2020
Set each industry’s 2023 share beside its own 2020 figure — the pandemic year — and the picture changes. Nine of the 16 are more than a point below it. Four are within a point either way. Three are more than a point above: information, educational services, and arts and entertainment, two of them from the hard-hit six. The largest gap is in real estate and rental, which lost only 0.9 points in 2020 and stood 8.2 points below its 2020 level by 2023, at 58.7%. Retail trade, the industry that rose in 2020, was 4.6 points below its 2020 level in 2023, at 51.9% — the lowest of the 16.
Percentage points. Bars to the left mean the 2023 share is below the 2020 share. The axis runs to 10 points in each direction. Mining, utilities and unclassified returns are left out: the first two are too small to read year to year, and the third is not an industry.
IRS, Statistics of Income, Nonfarm Sole Proprietorship Returns, Table 1, tax years 2013-2023 (files 13sp01br.xls through 23sp01br.xls), retrieved from irs.gov on September 17, 2026. Share = returns with net income divided by all returns.
What to take from this if you run a business on your own
A shock with a name is easy to see and easy to rally against, and in this data the one in 2020 was largely repaired within a year. The slower squeeze that followed had no such moment, and by 2023 it had pushed the share of returns reporting a profit lower than the pandemic year had. The practical reading is to check your own numbers against your own last good year, not against the last crisis. A year that feels ordinary can still be a worse year than the one everyone remembers as bad.
Four limits worth holding. A Schedule C is filed by anyone with self-employment income, from a full-time contractor to a weekend side job, so these are returns, not companies. The IRS figures are estimates from a sample of returns, so a move of less than a point in one industry is treated here as no change. Net income is after deductions such as depreciation and vehicle costs, so a return can show a loss while the owner’s cash is fine. And the table says what happened, not why: nothing in it ties the 2020 or 2023 falls to any cause.
IRS, Statistics of Income, Nonfarm Sole Proprietorship Returns, Table 1.
Frequently Asked Questions
Did the pandemic year hurt solo-business profits?
Yes, but briefly. The number of sole proprietorship returns reporting a profit fell by 91,950 in 2020 and rose by 1,125,202 in 2021, according to IRS Statistics of Income tables.
Was 2020 the worst recent year for sole proprietor profits?
Not on these measures. The profitable count fell by 555,991 in 2023, about six times the 2020 drop, and the share reporting a profit was 68.8% in 2023 against 70.5% in 2020.
Which industries were hit hardest in 2020?
Information, arts and entertainment, wholesale trade, food service and accommodation, manufacturing, and other services each saw the share of returns reporting a profit fall by three points or more.
How fast did they recover?
Within a year. All six won back more than half of their 2020 loss in 2021, and manufacturing and information finished 2021 above their 2019 level.
Which industry is furthest below its 2020 level?
Real estate and rental. Its share reporting a profit fell 0.9 points in 2020 and stood 8.2 points below the 2020 level by 2023.
Published by The Lonely Entrepreneur — the community and coaching platform for entrepreneurs who are building alone. lonelyentrepreneur.com
This article is for educational purposes and is not a substitute for professional financial or legal advice.