

 Founder Data Report
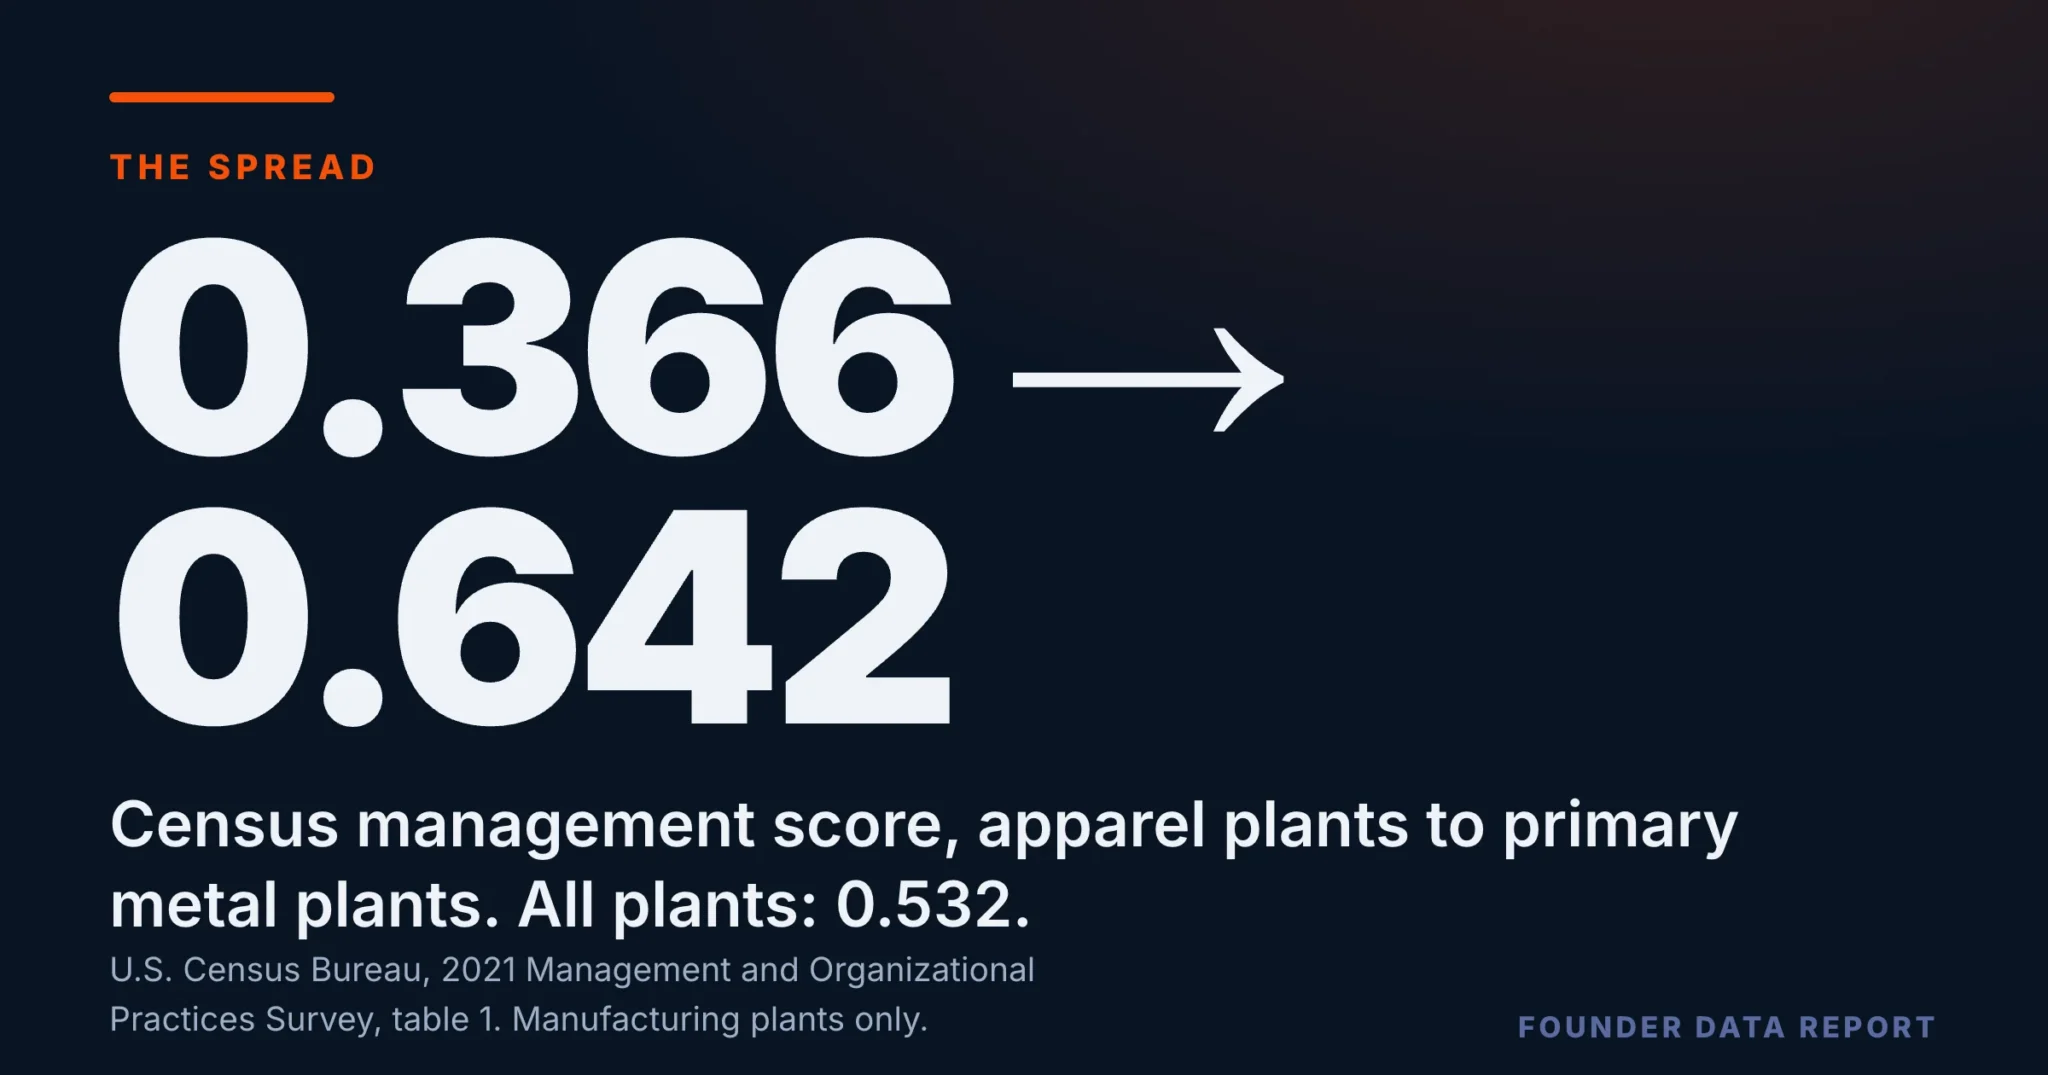
Apparel Plants Score 0.366 on Census’s Management Scale. Primary Metal Plants Score 0.642.
You can’t afford to risk your business without a Sidekick at your side.
Census scored how structured management is inside U.S. manufacturing plants. Scores differ far more between trades than between states.
In the Census Bureau’s 2021 Management and Organizational Practices Survey, the structured-management score of U.S. manufacturing plants runs from 0.366 in apparel to 0.642 in primary metals, against 0.532 for all plants. Nine of 21 manufacturing trades score above the all-plant figure by more than their margins of error and eight score below it. Location separates far less: 39 of 50 states are level with the nation. Asked what happened after their last production problem, 55.5% of plants said they fixed it, acted to stop a repeat and ran a continuous-improvement process; 7.6% fixed it and stopped there or took no action.
- Score from 0 (least structured) to 1 (most). All manufacturing plants: 0.532.
- By trade it runs from 0.366 (apparel) to 0.642 (primary metals), a gap of 0.276.
- Nine trades sit above the all-plant score, eight below, four level. Every trade above clears every trade below on the margins of error.
- By state, 39 of 50 are level with the nation. Seven sit above, four below.
- After a production problem, 55.5% of plants fixed it, prevented a repeat and ran a continuous-improvement process. 7.6% stopped at the fix or did nothing.
Trade by trade, the spread is wide
Census builds the score from sixteen of the survey’s questions: how a plant handles production problems, how many performance measures it tracks and who reviews them, how it sets targets, and how it promotes, rewards and moves people. Each answer is placed on a 0 to 1 scale and the sixteen are averaged. Across every plant in the survey the result is 0.532. Split by trade, it spreads a long way. Primary metals (0.642), paper and transportation equipment (both 0.628), plastics and rubber (0.624) and chemicals (0.617) lead a group of nine trades that sit clearly above the all-plant score. Apparel (0.366), leather (0.418), printing (0.430) and textile products (0.433) lead the eight that sit clearly below it. The two groups do not overlap: every trade in the upper group clears every trade in the lower one on the margins of error.
Score from 0 (least structured) to 1 (most), drawn on a 0 to 1 scale. Orange: above the all-plant score of 0.532 by more than the combined margin of error. Slate: below it by more than the margin. Amber: level with it within the margins. Neighboring trades near the top, and apparel and leather at the bottom, are level with each other.
U.S. Census Bureau, 2021 Management and Organizational Practices Survey (MOPS), survey tables 1, 2, 5 and 6 (mops_survey_tables_2021.xlsx, published April 2023, the most recent MOPS release), retrieved from census.gov on October 9, 2026 and re-checked October 12, 2026. Manufacturing plants only.
Every trade in the upper group clears every trade in the lower one. By state, 39 of 50 are level with the nation.
Where the plant sits matters far less
The same score by state tells a quieter story. Of 50 states, 39 are level with the nation on their margins of error; their scores run from 0.478 to 0.562. Seven sit above it — Alabama and New Hampshire (both 0.577), Arizona and Mississippi (both 0.572), South Carolina (0.571), North Carolina (0.563) and Wisconsin (0.557). Four sit below — California (0.487), New York (0.477), New Jersey (0.470) and Rhode Island (0.426), whose estimate is the least precise of the four at plus or minus 0.088. By region, the South (0.546) and the Midwest (0.542) are level with each other and both sit above the West (0.510) and the Northeast (0.506). Census does not publish the state score by trade, so a state’s position may partly reflect which trades its plants are in.
Score from 0 to 1, drawn on a 0 to 1 scale. Orange: above the all-plant score of 0.532 by more than the combined margin of error. Slate: below it. The other 39 states are level with the nation. The District of Columbia is withheld by Census.
U.S. Census Bureau, 2021 Management and Organizational Practices Survey (MOPS), survey tables 1, 2, 5 and 6 (mops_survey_tables_2021.xlsx, published April 2023, the most recent MOPS release), retrieved from census.gov on October 9, 2026 and re-checked October 12, 2026. Manufacturing plants only.
One of the sixteen questions, up close
One question in the score asks what happened the last time a production problem arose. 55.5% of plants gave the most structured answer: they fixed it, acted so it would not happen again, and had a continuous-improvement process to anticipate problems like it. Another 36.9% fixed it and acted to stop a repeat, without the ongoing process. 5.8% fixed it and took no further action, and 1.8% took no action at all. Census publishes this answer nationally only, not by trade or state.
One answer per plant; the four shares add to 100% within rounding. National figures only.
U.S. Census Bureau, 2021 Management and Organizational Practices Survey (MOPS), survey tables 1, 2, 5 and 6 (mops_survey_tables_2021.xlsx, published April 2023, the most recent MOPS release), retrieved from census.gov on October 9, 2026 and re-checked October 12, 2026. Manufacturing plants only.
What to take from this if you are building a company
Benchmark against your own trade, not against an average. A 0.50 means something different in printing than it does in chemicals, and the gap between trades here is much wider than the gap between most states. The score is a checklist in disguise: how you handle a problem after the fix, how many numbers you track and who looks at them, whether targets exist, and what happens when someone is promoted or falls short. Pick the question where your own answer is the least structured and settle it before the company grows into it. If you are the one carrying every one of those answers in your head, that is the burden to hand off first.
Four limits worth holding. MOPS covers manufacturing plants only, and its frame is multi-plant companies plus large single-plant companies, so small single-plant shops are outside it. The figures are estimates from a sample and are treated as different only when the gap clears both margins of error. The trade table does not hold plant size fixed: Census’s size table shows the score rises with headcount, so part of a trade’s position may reflect how big its plants are, and Census does not publish trade by size. And the survey records practice, not reasons.
U.S. Census Bureau, 2021 Management and Organizational Practices Survey.
Frequently Asked Questions
What is the structured management score?
A Census measure built from sixteen questions in the 2021 Management and Organizational Practices Survey. Each answer is scaled from 0 (least structured) to 1 (most) and the sixteen are averaged. Across all manufacturing plants the score is 0.532.
Which manufacturing trades score highest and lowest?
Primary metals (0.642), paper and transportation equipment (both 0.628) and plastics and rubber (0.624) sit at the top and are level with each other. Apparel (0.366) and leather (0.418) sit at the bottom, also level with each other.
Does the state a plant is in make a difference?
Less than the trade does. 39 of 50 states are level with the nation on their margins of error. Seven sit above and four below.
What do plants do after a production problem?
55.5% fixed it, acted to stop a repeat and ran a continuous-improvement process. 36.9% fixed it and acted to stop a repeat. 7.6% stopped at the fix or took no action.
Does this cover small businesses?
Not directly. MOPS covers manufacturing plants of multi-plant companies and large single-plant companies. Small single-plant shops are outside it.
Published by The Lonely Entrepreneur — the community and coaching platform for entrepreneurs who are building alone. lonelyentrepreneur.com
This article is for educational purposes and is not a substitute for professional financial or legal advice.