

 Founder Data Report
More Than Half of Manufacturing Plants Rarely or Never Move an Underperforming Manager
You can’t afford to risk your business without a Sidekick at your side.
Census asked manufacturing plants how they handle the people who underperform. The answer depends on who it is — and managers get the softer deal.
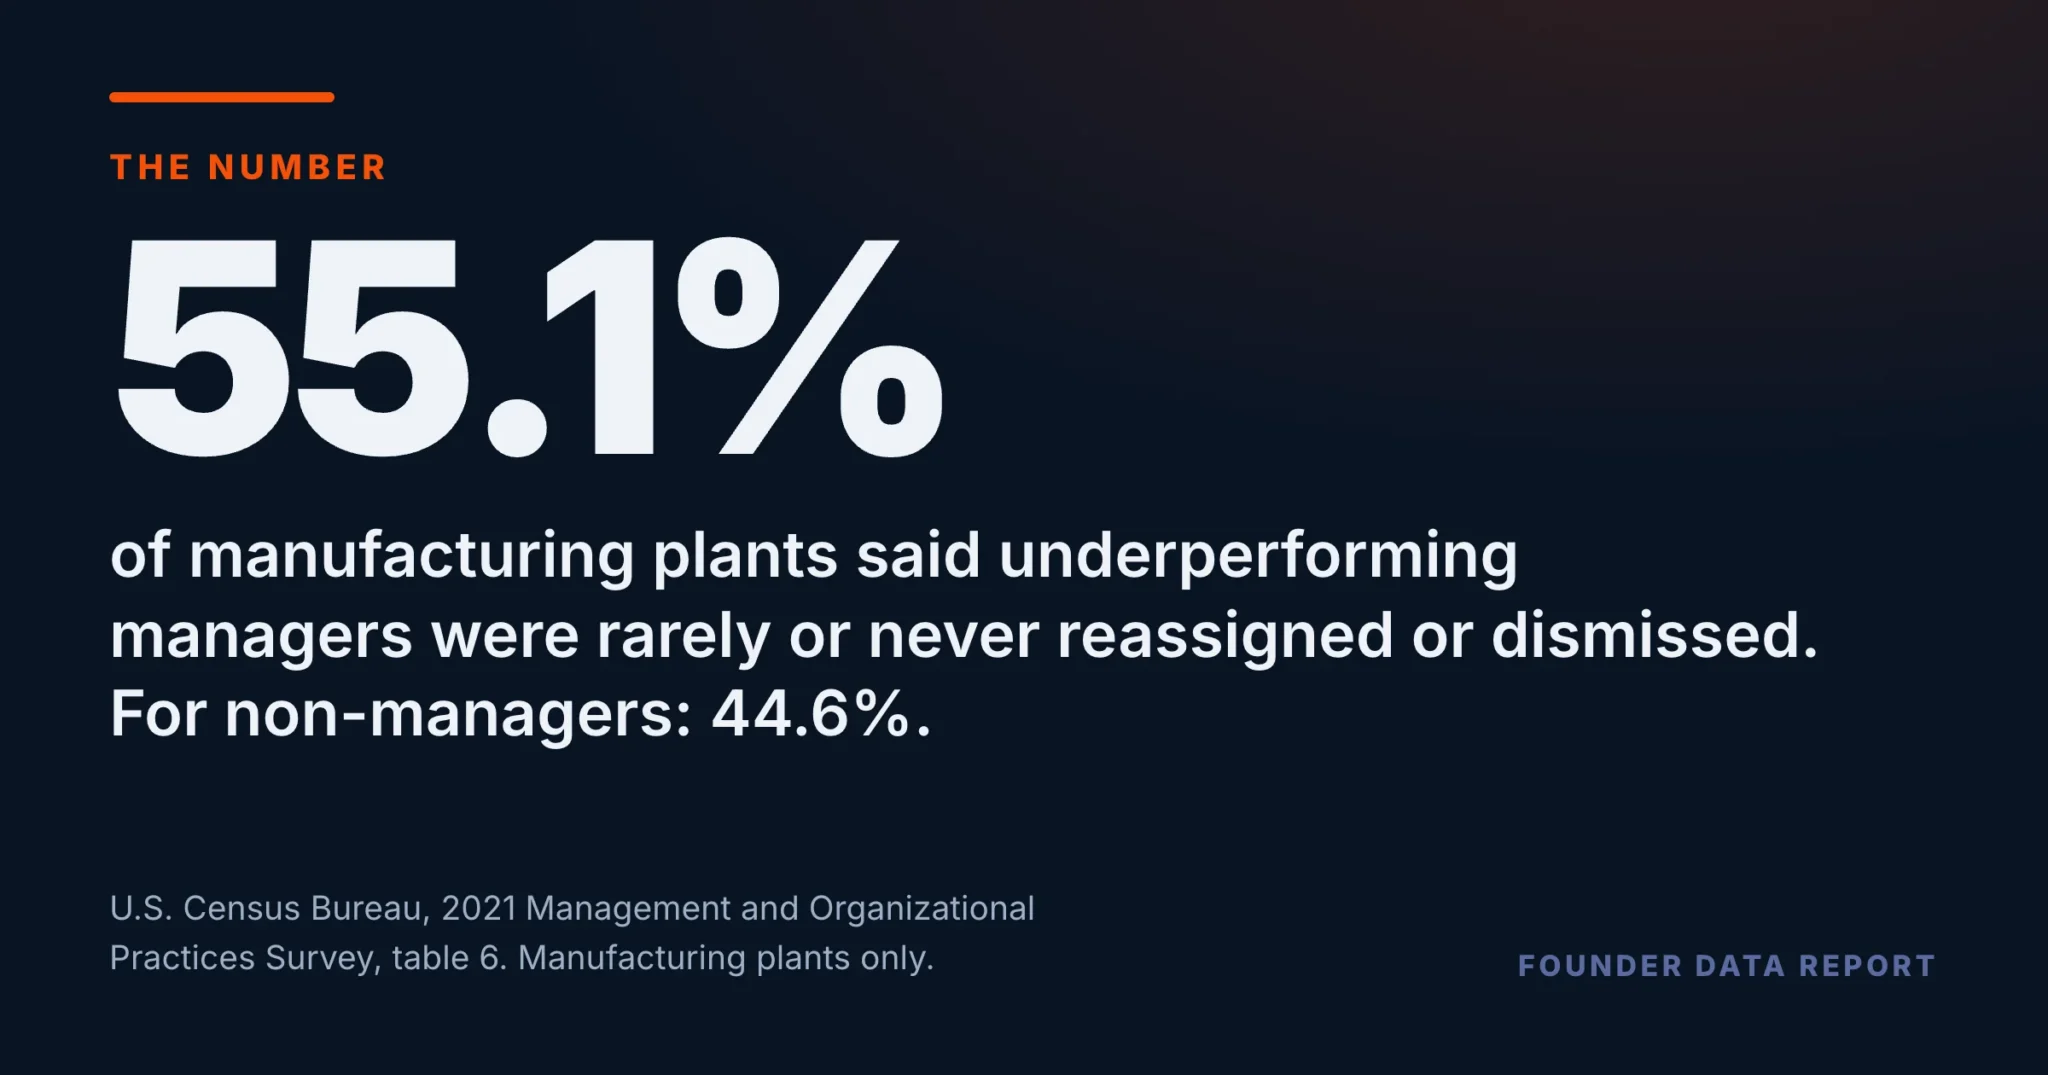
In the Census Bureau’s 2021 Management and Organizational Practices Survey, 55.1% of U.S. manufacturing plants said underperforming managers were rarely or never reassigned or dismissed. For underperforming non-managers the figure was 44.6%. Within six months, 39.9% of plants acted on an underperforming non-manager, against 27.2% for a manager — yet plants were more likely to pay managers a performance bonus. Across plant sizes, Census’s structured-management score rises from 0.402 at 1 to 4 employees to 0.742 at 2,500 or more, with the steepest climb between 20 and 250 employees. Plant age makes no measurable difference.
- Underperformers rarely or never moved: managers 55.1%, non-managers 44.6%.
- Acted on within six months: non-managers 39.9%, managers 27.2%.
- No performance bonuses: non-managers 50.1%, managers 38.6%.
- Structured management rises with plant size, fastest from 20 to 250 employees. Under 20, the bands are level; plant age does not separate at all.
- The survey covers manufacturing plants of multi-plant companies and large single-plant companies. It records practices, not reasons.
Two standards for the same problem
MOPS asks each plant in its sample a set of plain questions about how the site is run. Two of them are the same question asked twice: when a non-manager is identified as underperforming, how soon are they reassigned or dismissed — and the same for a manager. The answers do not match. For non-managers, 39.9% of plants act within six months and 44.6% rarely or never act. For managers, 27.2% act within six months and 55.1% rarely or never do. Every one of these gaps is many times its margin of error. The difference runs the other way on rewards: 50.1% of plants pay non-managers no performance bonus, against 38.6% for managers. Managers are more likely to be paid for results and less likely to be moved when the results are not there.
Orange is managers, slate is non-managers. Each bar is drawn on a 0% to 100% scale. Every pair differs by more than its combined margin of error. The bonus row is one answer to a select-all-that-apply question.
U.S. Census Bureau, 2021 Management and Organizational Practices Survey (MOPS), survey tables 3, 4 and 6 (mops_survey_tables_2021.xlsx, published April 2023, the most recent MOPS release), retrieved from census.gov on October 9, 2026. Manufacturing plants only.
Managers were more likely to be paid for results, and less likely to be moved when the results were not there.
Where structure arrives as a plant grows
Census turns sixteen of the survey’s questions into one structured-management score, from 0 for the least structured answers to 1 for the most. Across all plants it is 0.532. By size it climbs from 0.402 at 1 to 4 employees to 0.742 at 2,500 or more, but not evenly. The three bands under 20 employees sit within 0.036 of each other and do not separate on their margins of error. From 20 to 49 upward, every band is clearly above the one before it. The score gains 0.207 between the 10-to-19 band and the 100-to-249 band, more than twice the 0.097 it gains from there to the largest plants. The single biggest step is from 20-to-49 employees to 50-to-99.
Score from 0 (least structured) to 1 (most), drawn on a 0 to 1 scale. Slate marks the three bands under 20 employees, which are level with each other within their margins of error.
U.S. Census Bureau, 2021 Management and Organizational Practices Survey (MOPS), survey tables 3, 4 and 6 (mops_survey_tables_2021.xlsx, published April 2023, the most recent MOPS release), retrieved from census.gov on October 9, 2026. Manufacturing plants only.
What does not matter: how old the plant is
It would be natural to expect older plants to have settled into more structured habits. The survey finds no sign of it. Plants up to five years old score 0.539 and plants 26 years or older score 0.531. The four age bands span 0.013, and no two of them differ by more than their margins of error. In this data, structure follows headcount, not years.
Score from 0 to 1, drawn on a 0 to 1 scale. Plant age is measured from the first year the site appears in Census’s business register. No two bands differ beyond their margins of error.
U.S. Census Bureau, 2021 Management and Organizational Practices Survey (MOPS), survey tables 3, 4 and 6 (mops_survey_tables_2021.xlsx, published April 2023, the most recent MOPS release), retrieved from census.gov on October 9, 2026. Manufacturing plants only.
What to take from this if you are building a team
If you run a company that is heading past 20 people, this is the stretch where the structured-management score climbs fastest — and the score is built from questions about targets, the measures someone reviews, and what happens when someone falls short. The manager question is the one to settle early. Decide before you promote or hire your first manager how long an underperforming manager gets, and make it the same clock you use for everyone else. In this data, underperforming managers are left in place more often than the people they manage.
Four limits worth holding. MOPS covers manufacturing plants only, and its frame is multi-plant companies plus large single-plant companies, so small single-plant shops are outside it. The figures are estimates from a sample and are treated as different only when the gap clears both margins of error. The manager-versus-non-manager answers are national; Census does not publish them by plant size. And the survey records practice, not reasons: nothing in it says why managers are moved less often.
U.S. Census Bureau, 2021 Management and Organizational Practices Survey.
Frequently Asked Questions
How often are underperforming managers moved or let go?
In the Census Bureau's 2021 Management and Organizational Practices Survey, 55.1% of manufacturing plants said underperforming managers were rarely or never reassigned or dismissed, and 27.2% acted within six months.
Are non-managers treated differently?
Yes. For non-managers, 44.6% of plants rarely or never act and 39.9% act within six months. Both gaps are many times their margins of error.
Do managers get performance bonuses more often?
Yes. 50.1% of plants pay non-managers no performance bonus, against 38.6% for managers.
Does management get more structured as a plant grows?
Yes. Census's structured-management score rises from 0.402 at 1 to 4 employees to 0.742 at 2,500 or more, with the steepest climb between 20 and 250 employees. Below 20 employees the bands are level.
Does this cover small businesses?
Not directly. MOPS covers manufacturing plants of multi-plant companies and large single-plant companies. Small single-plant shops are outside it.
Published by The Lonely Entrepreneur — the community and coaching platform for entrepreneurs who are building alone. lonelyentrepreneur.com
This article is for educational purposes and is not a substitute for professional financial or legal advice.