

 Founder Data Report
Workplaces With Fewer Than 10 Staff Had Their Lowest Quit Rate in Ten Years in 2025. So Far, 2026 Is Lower Still.
Get clarity — download the free Entrepreneur Survival Guide Summary.
Quits are down at workplaces of every size since 2019. At the smallest ones, they have kept falling into 2026 while most larger bands have levelled off.
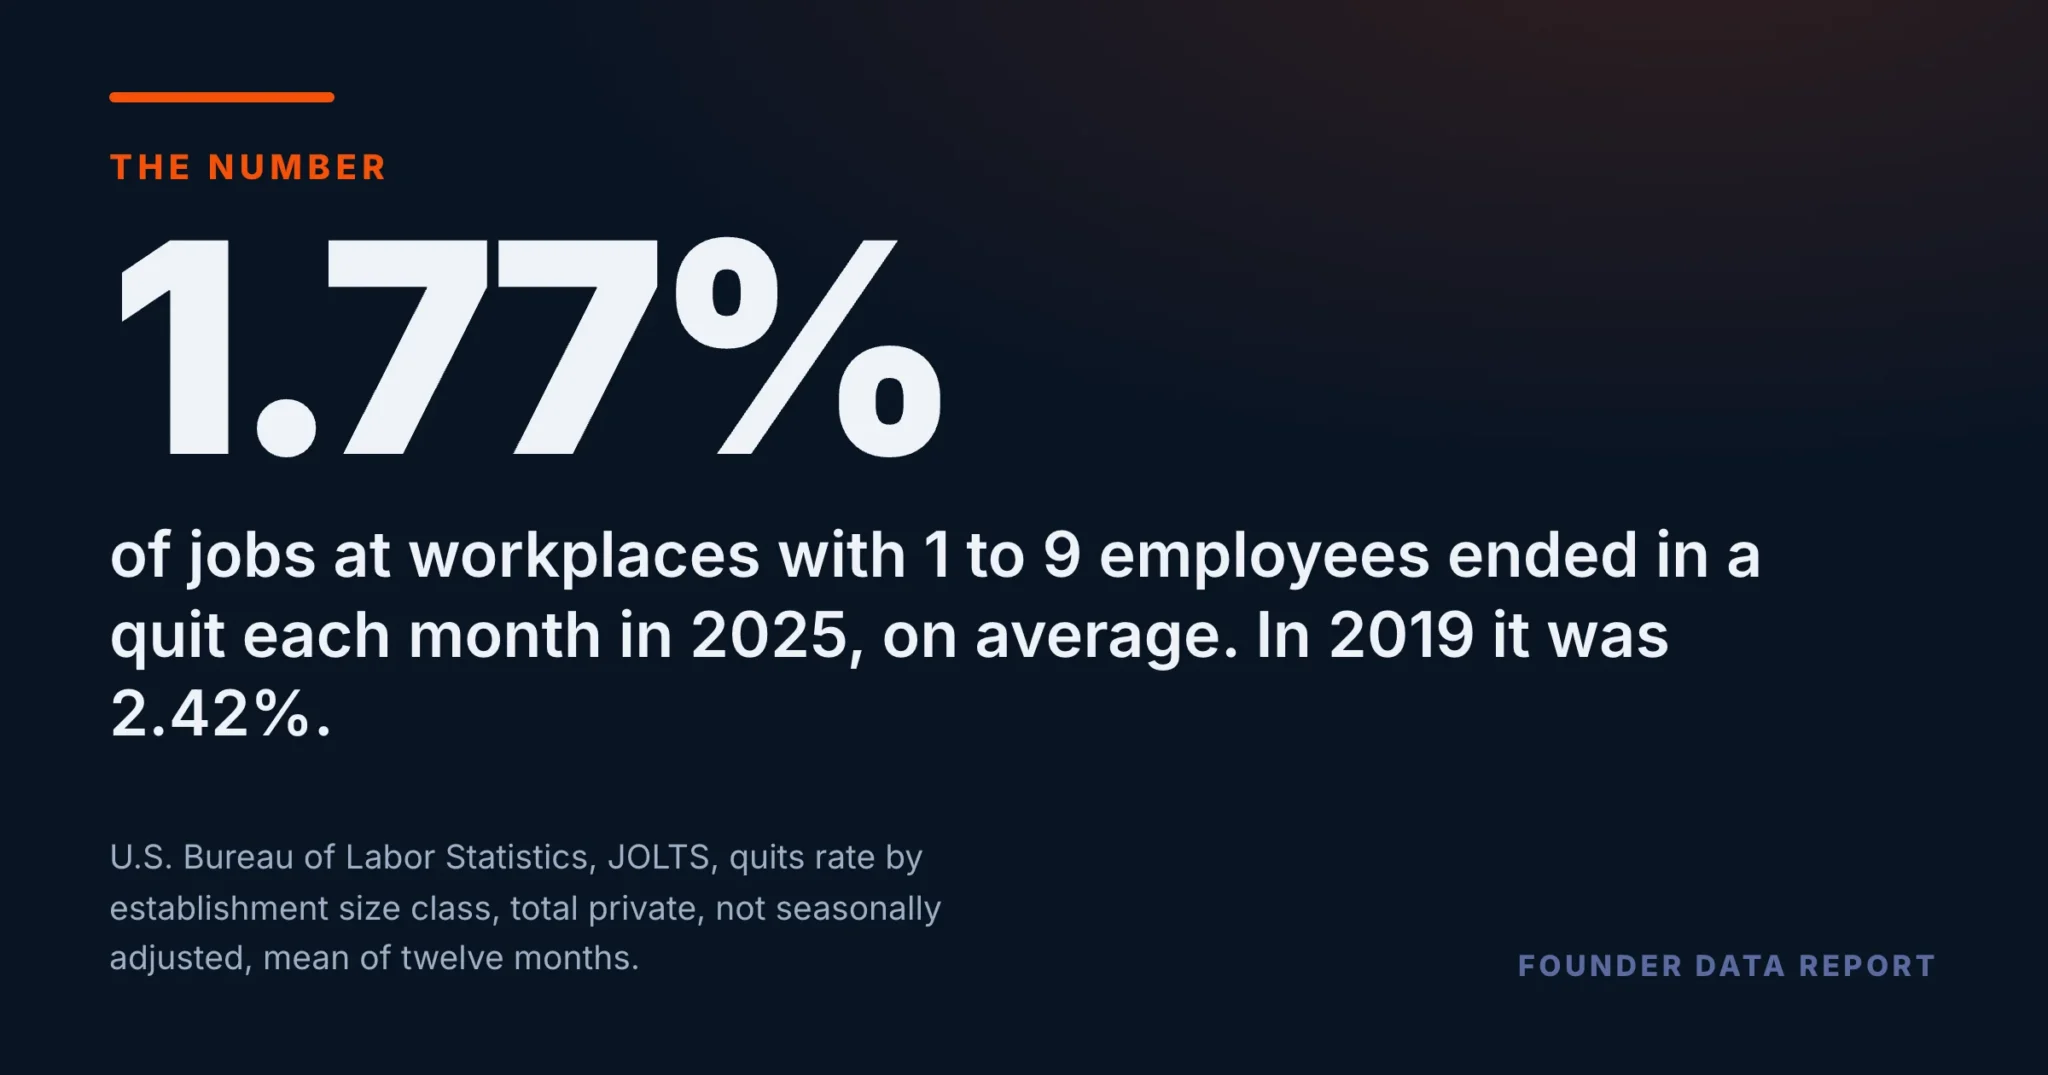
At workplaces with 1 to 9 employees, an average of 1.77% of jobs ended in a quit each month in 2025, according to the Bureau of Labor Statistics. That is the lowest annual rate in the ten years from 2016, down 27% from 2.42% in 2019 and 30% from the 2.53% peak in 2021. The first eight months of 2026 are lower still: 1.70%, against 1.98% in the same months of 2025. Quits are below their 2019 rate at workplaces of every size, but the smallest band is the one where the fall has carried on most clearly into 2026.
- Workplaces with 1 to 9 employees: monthly quit rate 1.77% in 2025, the lowest of any year since 2016. It was 2.42% in 2019 and 2.53% in 2021.
- January to August 2026 averaged 1.70%, the lowest reading for those months in eleven years, and below 1.98% a year earlier.
- Every size band quit less in 2025 than in 2019. Across all private workplaces, the 2025 rate of 2.21% is also the lowest since 2016.
- Hiring fell too. The smallest workplaces hired at 3.38% a month in 2025, against 4.03% in 2019. Both rates are the lowest since 2016.
- For every 100 hires at the smallest workplaces in 2025 there were 52 quits, down from 60 in 2019.
At the smallest workplaces, quitting is rarer than at any point since 2016
The Job Openings and Labor Turnover Survey publishes turnover by the size of the workplace. In the band with 1 to 9 employees, the monthly quit rate climbed from 2.42% in 2019 to 2.53% in 2021, then fell four years running to 1.77% in 2025. That is below every year in the series from 2016, including the 2.12% and 2.08% of 2016 and 2017. The hire rate also fell, to 3.38% in 2025, which is its lowest annual reading since 2016 as well. A quit rate counts quits per 100 jobs in a month. It is not a count of people.
Orange is the quit rate, slate the hire rate; the colours name the measure, not which is better. Both use one scale. Each figure is the mean of twelve monthly, not seasonally adjusted rates, which cancels the quarter-start pattern this size band shows month to month.
U.S. Bureau of Labor Statistics, Job Openings and Labor Turnover Survey (JOLTS), quits, hires and layoffs rates by establishment size class, total private, not seasonally adjusted, January 2016 to August 2026, BLS public data API, retrieved October 7, 2026. Annual figures are the mean of twelve monthly rates; 2026 months are the latest published and partly preliminary.
At the smallest workplaces, the quit rate and the hire rate are both the lowest of any year since 2016.
Down at every size since 2019
Every one of the six size bands had a lower quit rate in 2025 than in 2019. Workplaces with 10 to 49 employees went from 2.88% to 2.41%. Those with 50 to 249 went from 2.75% to 2.54%, the highest 2025 rate of any band. At 5,000 or more, the rate went from 1.04% to 0.82%. Among workplaces under 1,000 employees, the smallest band now has the lowest quit rate; the 1,000-to-4,999 band, at 1.74%, is a hair below it. Two bands are not at a ten-year low: the 50-to-249 and 250-to-999 bands both sat lower in 2016.
Slate is 2019, orange is 2025; the colours name the year. One scale across all bands. Size class is the workplace’s largest employment over the prior twelve months, set when it enters the sample. Response rates are lower in the larger bands, so those rates carry more uncertainty.
U.S. Bureau of Labor Statistics, Job Openings and Labor Turnover Survey (JOLTS), quits, hires and layoffs rates by establishment size class, total private, not seasonally adjusted, January 2016 to August 2026, BLS public data API, retrieved October 7, 2026. Annual figures are the mean of twelve monthly rates; 2026 months are the latest published and partly preliminary.
2026 so far: still falling where it is smallest
Comparing the same months of each year sets aside the seasonal swing. From January to August 2026, the smallest workplaces averaged a quit rate of 1.70%, against 1.98% over the same months of 2025 and 2.51% in 2019. It is the lowest January-to-August reading in the eleven years from 2016. In the larger bands, 2026 so far sits within about a tenth of a point of 2025, a little above it in two. The smallest band’s drop, 0.28 points, is more than twice the largest move in any other. The most recent months are preliminary and the survey revises them. The survey does not publish a margin of error for these size-class rates, so treat the 2026 change as a direction rather than a precise size. Nor does it record why people quit, and this article does not supply a reason.
Orange marks 2026; slate bars are earlier years. Same eight months in every year, so the seasonal pattern cancels. The axis runs from 0% to 3%. 2026 includes preliminary months.
U.S. Bureau of Labor Statistics, Job Openings and Labor Turnover Survey (JOLTS), quits, hires and layoffs rates by establishment size class, total private, not seasonally adjusted, January 2016 to August 2026, BLS public data API, retrieved October 7, 2026. Annual figures are the mean of twelve monthly rates; 2026 months are the latest published and partly preliminary.
What to do with this if you run a small team
If you lead a team of fewer than ten, the workplaces most like yours are seeing the lowest monthly quit rate since 2016, and the lowest hire rate too. Across the band, a team is less likely to turn over in a given month than at any point in a decade, so the team you have is more likely to be the team you lead next year. That makes the work of developing the people already there — what each one owns, what they are learning, who could step up — a bigger share of the job than finding replacements. A low quit rate tells you people are staying. It does not tell you how they feel about it, and only you can find that out.
Four limits worth holding. These are workplaces (establishments), not companies — a firm with several small sites shows up in the small bands. A quit rate is quits per 100 jobs per month, not a share of people. The size bands are reset each year, so this article compares rates, never counts, across years: the jobs counted in a band moved by anywhere from 4% to 62% between 2019 and 2025. And the latest months are preliminary.
U.S. Bureau of Labor Statistics, JOLTS, quits rate by establishment size class, total private, not seasonally adjusted.
Frequently Asked Questions
What is the quit rate at small workplaces?
According to the Bureau of Labor Statistics' JOLTS survey, workplaces with 1 to 9 employees averaged a monthly quit rate of 1.77% in 2025 — the lowest annual average since at least 2016. It was 2.42% in 2019.
Is the quit rate still falling in 2026?
At the smallest workplaces, yes so far. January to August 2026 averaged 1.70%, against 1.98% for the same months of 2025. Most larger size bands are close to their 2025 level. The latest months are preliminary.
Do people quit small workplaces more than large ones?
Not at the smallest end. In 2025, the 1-to-9 band's quit rate (1.77%) was the lowest of any band under 1,000 employees. The highest was the 50-to-249 band, at 2.54%.
Has hiring fallen as well?
Yes. Workplaces with 1 to 9 employees hired at an average monthly rate of 3.38% in 2025, down from 4.03% in 2019 and the lowest since 2016. In 2025 there were 52 quits for every 100 hires, down from 60.
Is a workplace the same as a business?
No. JOLTS measures establishments — single locations. A company with several small locations is counted in the small size bands, so these figures describe small workplaces, not small companies.
Published by The Lonely Entrepreneur — the community and coaching platform for entrepreneurs who are building alone. lonelyentrepreneur.com
This article is for educational purposes and is not a substitute for professional financial or legal advice.