

 Founder Data Report
Workplaces With Under 10 Employees Now Post Job Openings Faster Than the Private Sector. Their Hiring Rate Has Not Followed
Get clarity — download the free Entrepreneur Survival Guide Summary.
If you lead a small shop, every open seat is yours to carry: the work, the pressure and the hiring decision. Federal data show the smallest workplaces now post openings faster than the rest of the private sector, while their hiring rate sits where it did.
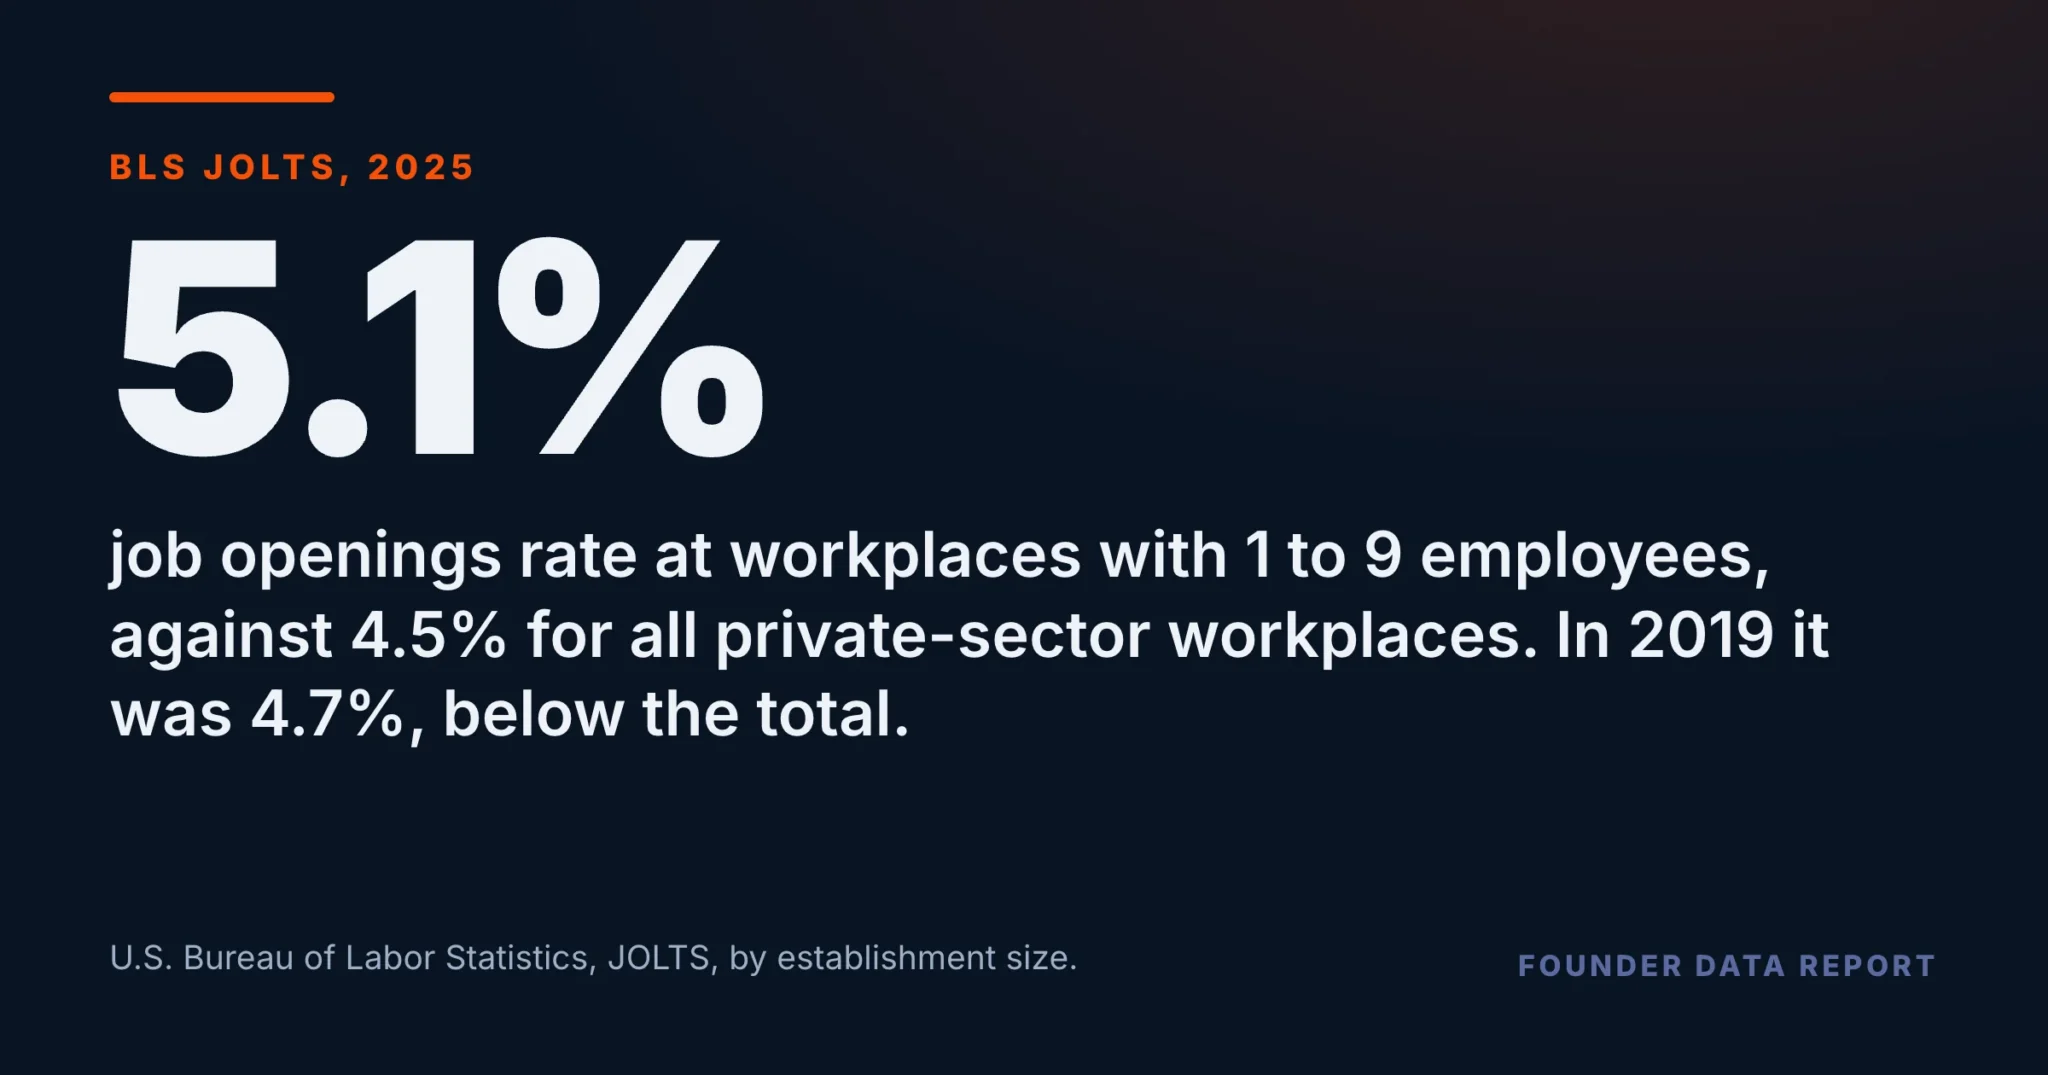
In the Bureau of Labor Statistics’ Job Openings and Labor Turnover Survey, workplaces with 1 to 9 employees posted job openings at 5.1% in 2025, against 4.5% for all private-sector workplaces. Before 2020 they ran below the total every year: 4.7% against 4.8% in 2019. Their hiring rate did not make the same move. It was 93% of the private-sector rate in 2025 and 94% in 2019.
That matters for leadership as much as for hiring. If you lead a team of fewer than ten, the responsibility for an open seat, and the decisions around it, may rest with you alone. The pressure of carrying open jobs is a burden the smallest workplaces are now carrying at a higher rate than the private sector as a whole.
- Openings rate at workplaces with 1 to 9 employees, as a share of the private-sector rate: 92% in 2016, 98% in 2019, 119% in 2023, 122% in 2024, 114% in 2025.
- Months in which the smallest workplaces’ openings rate was above the total: 4 of 12 in 2019, 11 of 12 in 2024. In 2025 it was at or above the total in all twelve.
- Hiring rate at the same workplaces: 94% of the private-sector rate in 2019, 93% in 2025.
- The hiring rate fell at every size from 2019 to 2025. The openings rate at the smallest workplaces is the part that pulled away from the rest.
- These are workplaces, not companies, and the survey does not say why the rates moved.
The question the survey asks every month
Every month the Bureau of Labor Statistics asks a sample of employers how many jobs they have open on the last business day of the month and how many people they hired during it. It publishes the answers as rates, and it breaks them out by the size of the workplace: 1 to 9 employees, 10 to 49, and so on up to 5,000 or more. The openings rate is open jobs as a share of filled jobs plus open jobs. The hires rate is hires as a share of filled jobs. The two have different bases, so this piece never sets one against the other. It compares each one at the smallest workplaces with the same rate for the whole private sector.
For the four years before 2020 the smallest workplaces posted openings at a lower rate than the private sector as a whole: 3.8% against 4.2% in 2016, and 4.7% against 4.8% in 2019. In 2016 their rate was the lowest of any size class. From 2020 to 2022 they were about level with the total.
Average of the twelve monthly rates in each year. The size-class series are not seasonally adjusted, so only whole-year averages are compared. Openings rate: open jobs as a share of filled jobs plus open jobs. The track runs from 0 to 8%.
U.S. Bureau of Labor Statistics, Job Openings and Labor Turnover Survey (JOLTS), job openings and hires rates by establishment size class, total private, not seasonally adjusted, 2016–2025; retrieved from the BLS public data API on October 30, 2026. Annual figures are the average of twelve monthly rates.
From 2023, the smallest workplaces moved out front
In 2023 the openings rate at workplaces with 1 to 9 employees was 6.9%, against 5.8% for all private workplaces and the highest of any size class. In 2024 it was 5.8% against 4.8%, highest again. In 2025 it was 5.1% against 4.5%, at or near the top of the size classes.
The month-by-month record says the same thing. These series are not seasonally adjusted, so the fair test is to compare the two rates in the same month. From 2016 to 2019 the smallest workplaces were above the total in two to four months a year. In 2023 it was 9 months, in 2024 11, and in 2025 10, with the other two months level.
Count of the twelve months in each year in which the smallest workplaces’ openings rate was higher than the rate for all private-sector workplaces in the same month. Bars on a 0 to 12 month scale. Highlighted: 2023 to 2025.
U.S. Bureau of Labor Statistics, Job Openings and Labor Turnover Survey (JOLTS), job openings and hires rates by establishment size class, total private, not seasonally adjusted, 2016–2025; retrieved from the BLS public data API on October 30, 2026. Annual figures are the average of twelve monthly rates.
The smallest workplaces are posting openings faster than the rest of the private sector. They are not hiring faster than it.
Hiring did not make the same move
The hires rate tells a different story. At workplaces with 1 to 9 employees it was 4.0% in 2019 and 3.4% in 2025. For all private workplaces it went from 4.3% to 3.6%. Hiring slowed at every size over those years, so the useful comparison is again with the total: the smallest workplaces hired at 94% of the private-sector rate in 2019 and 93% in 2025.
Their hires rate was above the total in 4 months of 2019 and 3 months of 2025. So the openings rate pulled ahead of the private sector while the hiring rate stayed about where it was against it. How many hires each opening turns into is a separate measure, covered in our piece on the seat you cannot fill.
Average of the twelve monthly rates in each year, not seasonally adjusted. Hires rate: hires during the month as a share of filled jobs. Its base differs from the openings rate’s, so the two are never compared directly. The track runs from 0 to 6%.
U.S. Bureau of Labor Statistics, Job Openings and Labor Turnover Survey (JOLTS), job openings and hires rates by establishment size class, total private, not seasonally adjusted, 2016–2025; retrieved from the BLS public data API on October 30, 2026. Annual figures are the average of twelve monthly rates.
What to take from this if you run a small one
In a workplace of fewer than ten people there may be no one else to hand an open seat to. If that is you, you cover the work, write the posting and make the hiring decision yourself. These numbers say that, since 2023, owners of the smallest workplaces have been carrying open jobs at a higher rate than the rest of the private sector, without a matching rise in the rate at which they hire. If that sounds like your year, you are not alone in it. It is worth asking how long each of your openings has been open, and what it is costing you to cover the seat yourself while it is.
Three limits worth holding. These are workplaces, counted by the number of people at one location, not companies. The size-class figures are not seasonally adjusted, so only whole years and same-month comparisons are used. And the survey does not say why the openings rate at the smallest workplaces moved ahead of the total.
U.S. Bureau of Labor Statistics, JOLTS, by establishment size.
Frequently Asked Questions
Do small businesses have more job openings than large ones?
In 2023 and 2024, workplaces with 1 to 9 employees had the highest job openings rate of any size class in the Bureau of Labor Statistics' JOLTS survey. In 2025 their rate was 5.1%, against 4.5% for all private-sector workplaces.
Was it always that way?
No. From 2016 to 2019 the smallest workplaces' openings rate was below the private-sector rate every year, 4.7% against 4.8% in 2019.
Are small businesses hiring faster too?
Not relative to everyone else. Their hires rate was 93% of the private-sector rate in 2025, about where it was in 2019 (94%).
Why did the openings rate at small workplaces rise?
The survey does not say. It records openings and hires each month; it does not ask employers the reason.
Where does the data come from?
The U.S. Bureau of Labor Statistics' Job Openings and Labor Turnover Survey, which publishes openings and hires rates by establishment size for the private sector. Figures here are averages of the twelve monthly rates in each year, 2016 to 2025.
Published by The Lonely Entrepreneur — the community and coaching platform for entrepreneurs who are building alone. lonelyentrepreneur.com
This article is for educational purposes and is not a substitute for professional financial or legal advice.