

 Founder Data Report
At Firms With 1 to 4 Employees, Most Lost Jobs Go When a Workplace Closes. At Every Larger Size, Most Go by Shrinking.
Join us Fridays at 12 PM ET to ask TLE CEO Michael Dermer your questions live.
Census records show how firms lose jobs, not just how many. Below five employees, most go when a workplace shuts. From five up, most go by cutting back and carrying on.
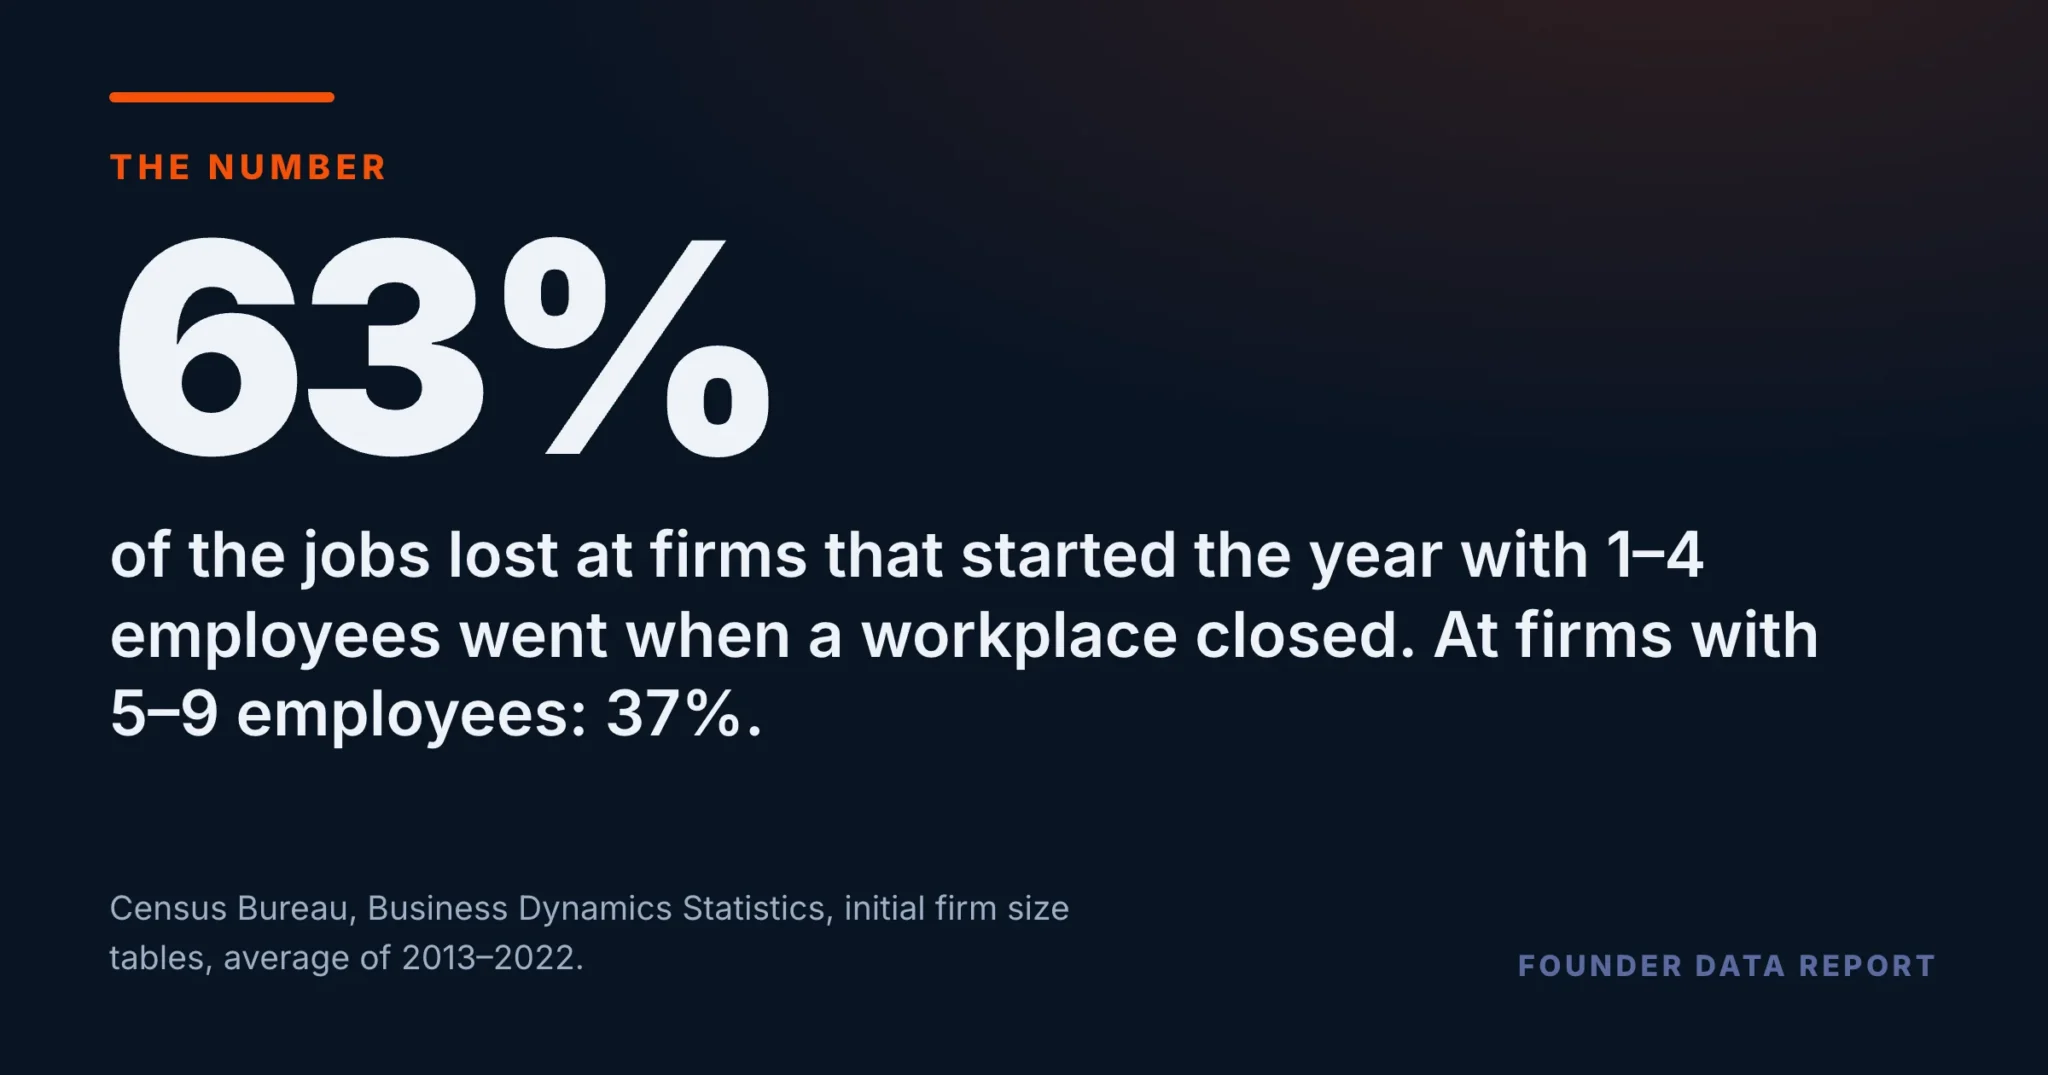
Census Bureau data on U.S. employer firms shows that the way a firm loses jobs depends on its size. At firms that started the year with 1–4 employees, an average of 63.2% of the jobs lost from 2013 to 2022 went when a workplace closed, and the rest when a workplace that stayed open cut back. At firms with 5–9 employees the closure share was 36.6%, and at every size from 5 employees to 10,000 or more it was below 40%. The 1–4 band was the exception in every year from 1979 to 2022.
- Share of lost jobs that went with a closing workplace, 2013–2022 average: 1–4 employees 63.2%, 5–9 employees 36.6%, all firms 32.1%.
- In every year from 1979 to 2022 the 1–4 band was above 59% and every larger band was below 45%.
- About three in four of those closure job losses at the smallest firms (47.8% of all their lost jobs) were at firms that shut down entirely.
- Firms are sized by their employment at the start of the year, so a firm that closed is counted at the size it had, not half of it.
- The data shows how jobs were lost, not why.
Closing or cutting back
The Census Bureau’s Business Dynamics Statistics track employer workplaces from one March to the next. When a workplace loses jobs, the file records whether it closed or stayed open and got smaller. Across all firms, closures account for about 32% of the jobs lost in a typical year and shrinking workplaces for the rest. Split by how many people the firm employed at the start of the year, one band breaks the pattern. At firms with 1–4 employees, 63.2% of lost jobs went with a closing workplace. At 5–9 employees it was 36.6%, at 20–99 it was 33.5%, and at 10,000 or more it was 28.8%. Between four employees and five, the usual way of losing a job switches from the doors closing to the business cutting back.
Orange marks firms with 1–4 employees, the only band above half. The remainder of each band’s lost jobs was at workplaces that stayed open and cut back.
U.S. Census Bureau, Business Dynamics Statistics, initial firm size tables (BDSIFSIZE), national, all sectors, reference years 2013–2022 (each year March to March), release dated September 2025, downloaded from www2.census.gov/programs-surveys/bds/data/ on October 10, 2026.
From five employees up, most lost jobs are at workplaces that cut back and carry on. Below five, most go with a closure.
It has looked like this for four decades
This is not a recent pattern or a pandemic one. Averaged by decade, the closure share at 1–4 employee firms was 63.9% in the 1980s, 61.5% in the 1990s, 62.2% in the 2000s and 62.9% in the 2010s. For firms with 5–9 employees it moved between 36.1% and 41.4%. In no single year from 1979 to 2022 did the smallest band fall below 59%, and in no year did any larger band reach 45%.
Orange is firms with 1–4 employees at the start of the year; slate is 5–9. Each figure is the average of the ten yearly shares in that decade.
U.S. Census Bureau, Business Dynamics Statistics, initial firm size tables (BDSIFSIZE), national, all sectors, reference years 1980–2019, averaged by decade (each year March to March), release dated September 2025, downloaded from www2.census.gov/programs-surveys/bds/data/ on October 10, 2026.
For the smallest firms, a closing workplace usually means a closing business
A closing workplace is not always a closing company. A chain can shut one store and keep the rest. The file separately counts jobs at firms that shut down entirely. At 1–4 employee firms those were 47.8% of all jobs lost, so about three in four of the closure losses in that band were whole firms closing. The share falls at every size step: 30.4% at 5–9, 26.6% at 20–99, 16.5% at 100–499 and 4.9% at 1,000–2,499. Larger firms close workplaces too, but mostly as one part of a business that carries on.
Bands of 2,500 employees and up are left out because Census suppresses several of their whole-firm closure cells and writes them as zero.
U.S. Census Bureau, Business Dynamics Statistics, initial firm size tables (BDSIFSIZE), national, all sectors, reference years 2013–2022 (each year March to March), release dated September 2025, downloaded from www2.census.gov/programs-surveys/bds/data/ on October 10, 2026.
What to take from this if you run a very small firm
The numbers describe a structural fact, not a verdict. A business with three or four people has little middle ground: in this data, when jobs go at that size, they mostly go with the workplace. From five people up, most job losses happen at workplaces that cut back and carry on. The practical reading for a very small firm is to build some of that middle ground on purpose: costs that can flex down, a cash reserve that buys time, work that can be shared rather than cut. Those are choices, and this table cannot show that they work. What it shows is where the smallest firms stand when a bad year arrives.
Four limits worth holding. The data covers employer firms, not one-person businesses without payroll. A job here is a position counted in March, so a workplace that cut and rehired within the year shows only its net change. Size is measured at the start of each year. And the file records how jobs were lost, not why.
U.S. Census Bureau, Business Dynamics Statistics, initial firm size tables, 2013–2022.
Frequently Asked Questions
How do small businesses lose jobs?
At firms with 1–4 employees, 63.2% of lost jobs went when a workplace closed, on average from 2013 to 2022, according to the Census Bureau's Business Dynamics Statistics. The rest were at workplaces that stayed open and cut back.
Is it different for slightly larger firms?
Yes. At firms with 5–9 employees the closure share was 36.6%, and at every larger size it was below 40%. Most of their lost jobs were at workplaces that stayed open.
Is this a recent change?
No. The 1–4 band was above 59% in every year from 1979 to 2022, and every larger band was below 45% in every year.
How is firm size measured here?
By the firm's employment at the start of each year. Census's other firm-size table averages the start and end of the year, which files a closed firm at half its size; this article uses the start-of-year version so closures are counted at the size the firm actually had.
Does the data say why the smallest firms close?
No. It records whether jobs were lost through a closing workplace or a shrinking one, not the reasons behind either.
Published by The Lonely Entrepreneur — the community and coaching platform for entrepreneurs who are building alone. lonelyentrepreneur.com
This article is for educational purposes and is not a substitute for professional financial or legal advice.