

 Founder Data Report
The Leadership Burden Doesn’t Age Out: At Firms 11+ Years Old, 13.2% of Settled Workers’ Jobs End Each Quarter in Food and Lodging, 4.9% in Finance
You can’t afford to risk your business without a Sidekick at your side.
You kept the doors open for eleven years. Does the job of keeping a crew together get lighter? The Census Bureau tracks how often settled workers’ jobs end, by firm age and by trade, and the trade still shows at the old firms.
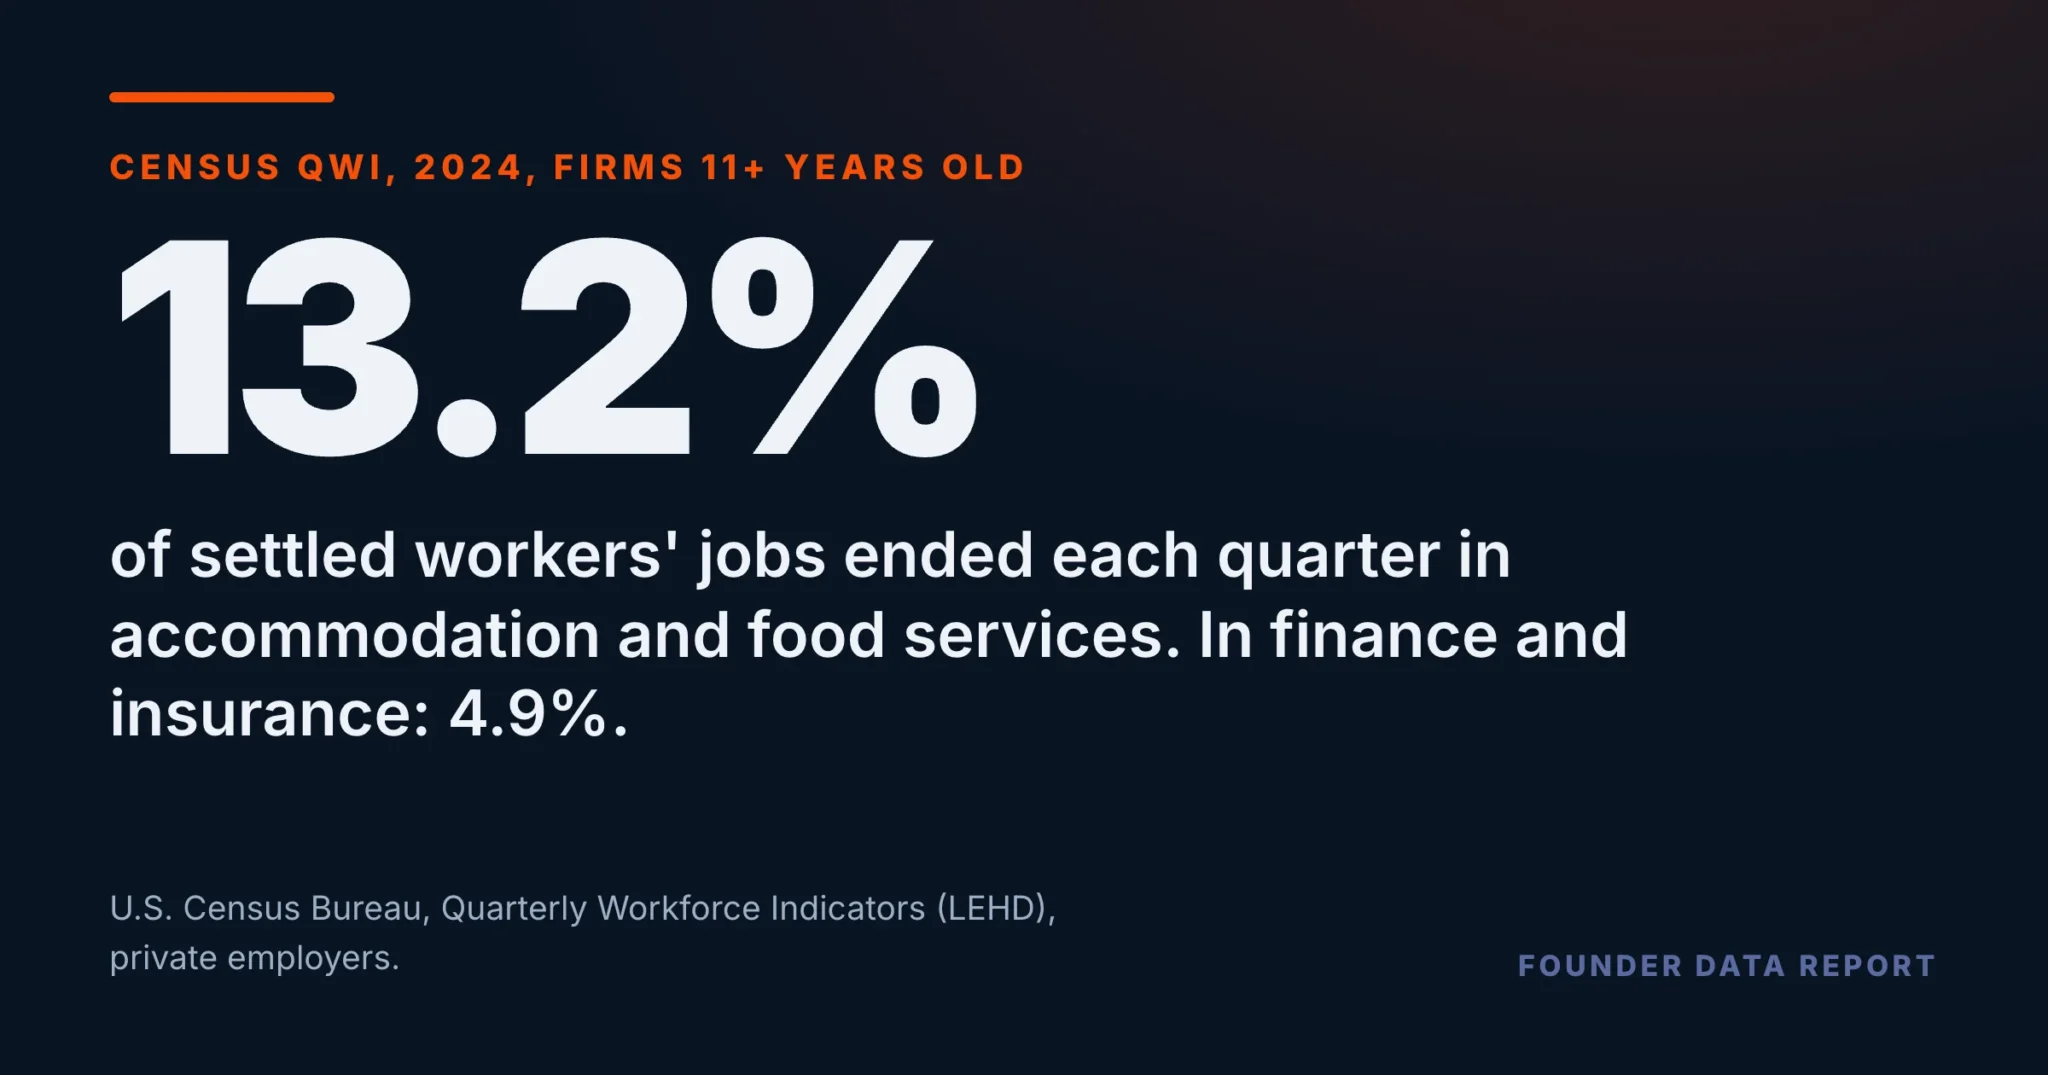
In the Census Bureau’s Quarterly Workforce Indicators, firms 11 years or older in accommodation and food services saw 13.2% of settled workers’ jobs end in a typical quarter of 2024. In finance and insurance, at the same firm age, it was 4.9%. A settled worker is someone who had held the job for at least a full quarter. Across all private employers, firms 11 or older ran 8.3%.
If you own the business, you know the part of the leadership burden that does not show up on a statement. Someone good gives notice, or a seat opens, and the work of filling it lands on you. A reasonable hope is that this eases once the firm has been around long enough.
The data gives that hope half an answer. Older firms do run lower: 13.6% at firms 0 to 1 year old against 8.3% at firms 11 or older, in all private employers. But set the old firms side by side, trade by trade, and they are not close to one another.
- At firms 11 or older in 2024, the share of settled workers’ jobs ending each quarter ran from 3.1% in utilities to 14.0% in administrative and support services.
- Accommodation and food services ranked second of 19 trades in all ten years from 2015 to 2024. Utilities ranked last in all ten.
- An old food-service firm ran above a brand-new finance firm in every one of those years: 13.2% against 8.7% in 2024.
- At old firms in administrative support and food service in 2024, most of these endings were over and above the jobs firms lost on net.
- The measure counts quits, layoffs and closures together. It does not say why a job ended.
Eleven years in, the trades are still far apart
At firms 11 years or older, 14.0% of settled workers’ jobs ended in a typical quarter of 2024 in administrative and support services, 13.2% in accommodation and food services and 12.7% in arts, entertainment and recreation. At the other end sit manufacturing at 5.7%, finance and insurance at 4.9% and utilities at 3.1%.
The order barely moves. Food service held second place in all ten years from 2015 to 2024. Administrative support was first in nine of them, and the exception was 2020, when arts and recreation jumped above it. Utilities was last in all ten. Whatever else changed in those years, the ranking at the top and the bottom stayed put.
Share of workers who had held a job for at least a full quarter and then saw it end, mean of four quarters. Bars on a 0 to 20% axis. Quits, layoffs and closures are counted together.
U.S. Census Bureau, Quarterly Workforce Indicators (LEHD), national, private employers, release R2026Q3: rate of separations from full-quarter employment by firm age and NAICS sector, mean of four quarters, 2024, not seasonally adjusted.
An old firm in one trade can run above a new firm in another
In every trade, the youngest firms ran above the oldest in every year from 2015 to 2024. How much lower is what varies. In utilities the 11-and-older rate is 28% of the rate at firms 0 to 1 year old. In finance it is 56%. In food service it is 71%, and in administrative support it is 88%, the closest of any trade in all ten years.
Set across trades, the comparison gets sharper. A food-service firm 11 or older ran at 13.2% in 2024. A finance firm 0 to 1 year old ran at 8.7%. The old food-service firm was above the new finance firm in all ten years. In 2024 it was above the youngest firms in 13 of the other 18 trades.
Food-service firms 11 years or older ran above finance firms 0 to 1 year old in every year from 2015 to 2024.
Share of settled workers’ jobs ending per quarter, mean of four quarters. Both bars on one 0 to 20% axis. Eight of 19 trades shown; the youngest firms run above the oldest in all 19.
U.S. Census Bureau, Quarterly Workforce Indicators (LEHD), national, private employers, release R2026Q3: rate of separations from full-quarter employment by firm age and NAICS sector, mean of four quarters, 2024, not seasonally adjusted.
Many of these jobs did not go away
The Census Bureau also counts the jobs firms lost on net, on the same base. Take that from the rate above and what is left is job endings over and above the shrinkage. At old firms in administrative support, the rate was 14.0% and jobs lost on net were 4.7%, which leaves 9.3 points. In food service it leaves 9.0. In finance, 2.6. In utilities, 1.8.
That is the part of the number closest to the owner’s desk: job endings that net shrinkage across firms does not account for. The split is not the same everywhere. In retail, those endings exceeded net job losses in all ten years, 7.0 points against 2.8% in 2024. In construction the two came out about even. In agriculture, net job losses were the larger part.
Points per quarter: the separation rate minus the firm job-loss rate, same base, printed as the difference of the two values to one decimal. Bars on a 0 to 12 point axis. Nine of 19 trades shown.
U.S. Census Bureau, Quarterly Workforce Indicators (LEHD), national, private employers, release R2026Q3: rate of separations from full-quarter employment, less full-quarter firm job losses, by firm age and NAICS sector, mean of four quarters, 2024, not seasonally adjusted.
What to take from this if you run one
If you run an established firm in one of the high-rate trades, plan on this being part of the job. Know your own number: how many people who had been with you at least a quarter left last quarter, and how many of those seats you refilled. Then look at where that work sits. If every one of those replacements comes through you, that is a decision about your time, and it is worth talking through with someone who has run a business and can tell you what to hand off.
If you run a low-rate trade, the comparison cuts the other way: a run of departures stands out more against what is typical for your trade. Check your number against your own trade, not against a business in a different one.
Three limits worth holding. The measure counts quits, layoffs and closures together, so it does not say anyone chose to go. It does not hold firm size or the mix of jobs fixed, and the file does not explain why one trade runs higher than another. And this data set publishes no margins of error, so these rates are given with the years they held in, not as tests of a difference.
U.S. Census Bureau, Quarterly Workforce Indicators (LEHD), release R2026Q3.
Frequently Asked Questions
Do older businesses keep their workers longer?
Older firms run lower rates in every trade. Across private employers in 2024, 13.6% of settled workers' jobs ended per quarter at firms 0 to 1 year old and 8.3% at firms 11 or older. The rate counts quits, layoffs and closures together.
Which trades have the highest rate at established firms?
In 2024, at firms 11 or older: administrative and support services at 14.0%, accommodation and food services at 13.2%, and arts, entertainment and recreation at 12.7%.
Which trades have the lowest?
Utilities at 3.1%, finance and insurance at 4.9%, and manufacturing and management of companies, both at 5.7%, at firms 11 or older in 2024.
Does this measure quits?
No. It counts workers who had held a job for at least a full quarter and then saw it end, for any reason. The published rate does not separate quits from layoffs or closures.
Where does the data come from?
The U.S. Census Bureau's Quarterly Workforce Indicators, from the Longitudinal Employer-Household Dynamics program, national private employers, release R2026Q3. Figures are means of four quarters, not seasonally adjusted.
Published by The Lonely Entrepreneur — the community and coaching platform for entrepreneurs who are building alone. lonelyentrepreneur.com
This article is for educational purposes and is not a substitute for professional financial or legal advice.