

 Founder Data Report
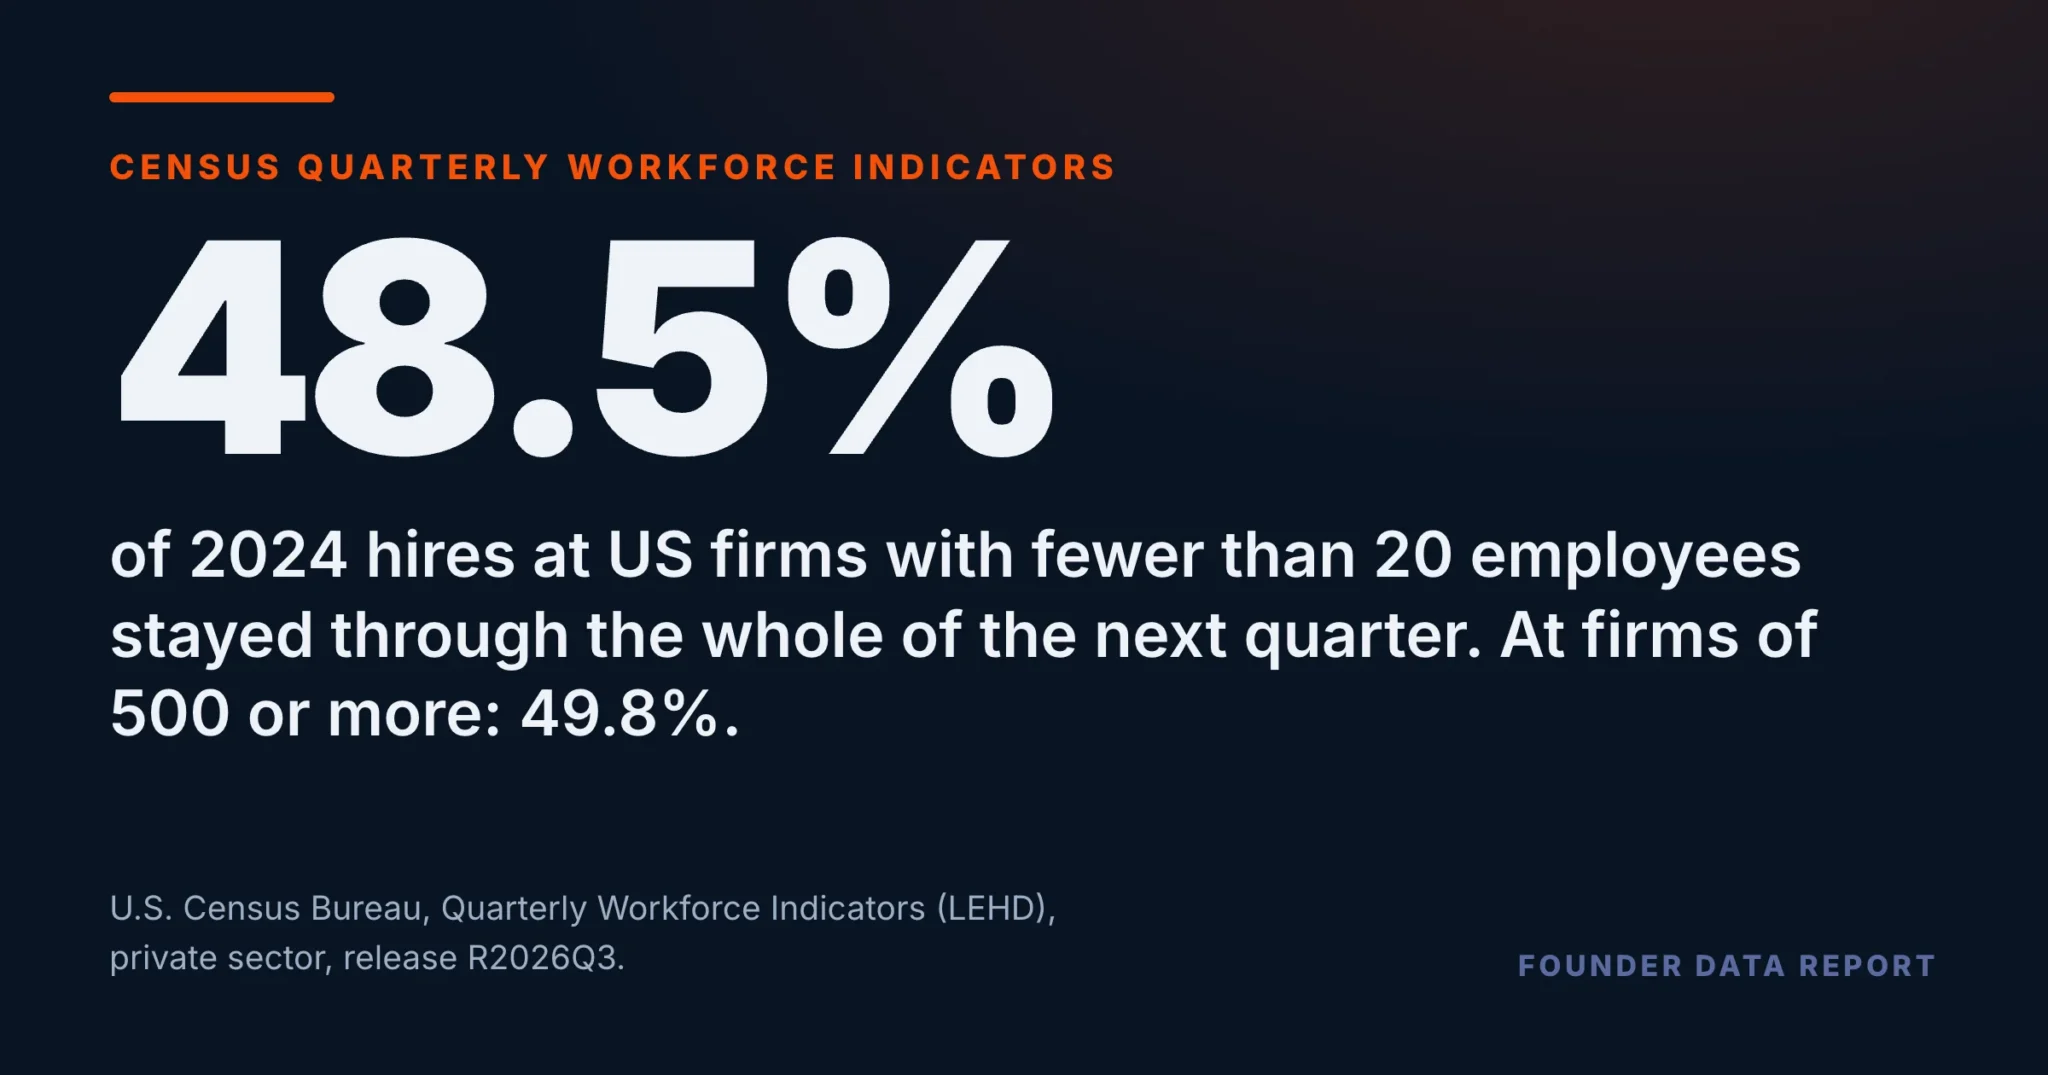
In 2024, 48.5% of Hires at Firms Under 20 Stayed Through the Next Full Quarter. At 500 or More: 49.8%
Get clarity — download the free Entrepreneur Survival Guide Summary.
Census payroll records follow every hire to see whether the job lasted. In 2024, at the smallest firms and the largest alike, about half did.
In the U.S. Census Bureau’s Quarterly Workforce Indicators, 48.5% of the people hired in 2024 by private firms with fewer than 20 employees stayed through the whole of the following quarter. At firms with 500 or more employees the figure was 49.8%, and every size band landed between 48.2% and 49.8%. The trade mattered far more than the size: by sector the share ran from 25.8% in agriculture to 64.3% in utilities.
- Firms with 0 to 19 employees made 17.8 million hires in 2024. 48.5% of them stayed through the whole next quarter.
- At 500 or more employees: 49.8%. Every size band sat within two points of every other.
- About 71 in 100 hires at the smallest firms were still on the payroll as the quarter they started ended. About 49 were still there a full quarter later.
- By sector, the share ran from 25.8% in agriculture to 64.3% in utilities.
- At firms under 20, the 2024 share was the highest of any year since 2010, up from 43.4% in 2019.
What the records follow
The Quarterly Workforce Indicators are built from the payroll records employers file for unemployment insurance, linked worker by worker. That lets the Census Bureau see each hire at two points: when the person first shows up on an employer’s payroll, and again a quarter later. A hire, in these records, is any worker who earned money at an employer in a quarter after earning nothing there the quarter before. The measure here is the share of those hires that turned into a job lasting at least one full quarter: still on the payroll from the first day of the next quarter to the last.
In 2024, private firms with fewer than 20 employees made 17.8 million hires. 48.5% of them stayed through the whole of the following quarter. Firms of 20 to 49 kept 48.2%, firms of 50 to 249 kept 48.4%, firms of 250 to 499 kept 48.9%, and firms of 500 or more kept 49.8%. Across all private firms, the figure was 49.1%.
Hires made in 2024. Slate: share still employed by the same firm as the quarter they started ended. Orange: share that stayed through the whole following quarter. The axis runs from 0 to 100%. Firm size is the firm’s employment nationwide.
U.S. Census Bureau, Quarterly Workforce Indicators (LEHD), national, private sector, by firm size, not seasonally adjusted, release R2026Q3; hires into full-quarter employment and all hires, 2024 hires followed into 2025; retrieved from lehd.ces.census.gov on October 21, 2026.
The first drop comes fast. At firms under 20, about 29 in every 100 hires were already gone by the end of the quarter they started in; about 71 were still there. Another 22 or so left before the next quarter was out. The same two steps show up at every size: 70.1% to 71.0% still on the payroll at the first quarter’s end, and 48.2% to 49.8% through the next.
The trade mattered more than the size
Size barely moves the number. The industry moves it a great deal. Across all firm sizes, 25.8% of 2024 hires in agriculture, forestry and fishing stayed through the next full quarter, and 35.9% in administrative and support services, the sector that includes staffing agencies. At the other end, utilities kept 64.3%, wholesale trade 62.2% and manufacturing 59.6%. Accommodation and food services, which made more hires than any other sector in 2024 (14.9 million), kept 44.3%. In 7 of the 19 sectors, fewer than half of the year’s hires stayed through the next full quarter.
All firm sizes. Orange: the highest and lowest sectors. Bars share one scale, 0 to 70%. Sectors are NAICS two-digit groups; workers placed by a staffing agency are counted at the agency.
U.S. Census Bureau, Quarterly Workforce Indicators (LEHD), national, private sector, by firm size, not seasonally adjusted, release R2026Q3; hires into full-quarter employment and all hires, 2024 hires followed into 2025; retrieved from lehd.ces.census.gov on October 21, 2026.
At the smallest firms and the largest, about half of 2024’s hires were still there a full quarter later.
Fifteen years at the smallest firms
At firms under 20 the share has moved. It was 43.9% in 2010 and 43.4% in 2019, then reached 48.5% in 2024, the highest of any year since 2010. The gap with the largest firms has narrowed. In 2010, firms of 500 or more kept 49.2% of their hires through the next quarter against 43.9% at firms under 20, a gap of about five points. In 2024 it was 49.8% against 48.5%, a gap of just over one. In 2020 and 2021 the smallest firms were ahead. The records do not say why the share moved.
Private firms with 0 to 19 employees nationwide. Each year’s hires followed into the next quarter. The axis starts at 40%.
U.S. Census Bureau, Quarterly Workforce Indicators (LEHD), national, private sector, by firm size, not seasonally adjusted, release R2026Q3; hires into full-quarter employment and all hires, 2024 hires followed into 2025; retrieved from lehd.ces.census.gov on October 21, 2026.
What to take from this if you run a small one
If you hire, you are hiring into a base rate that has nothing to do with being small. Across the economy, about one hire in two does not last through the next full quarter, at a ten-person shop and at a company of thousands. That changes the arithmetic of a hire. Filling one seat with someone who stays that long can mean making about two hires, and the time each takes: the posting, the interviews, the first weeks of training. Plan for that cost up front rather than reading every early exit as a failure of your judgment.
Three limits worth holding. A hire here is anyone newly on an employer’s payroll, so seasonal work, temporary jobs and someone who left after a day are all in the count, and the records cannot say which jobs were meant to be short. They also do not say why a job ended, or whether the worker quit or was let go. And the Census Bureau adds a small amount of noise to these figures to protect confidentiality; at national totals of millions of hires it does not change the picture.
U.S. Census Bureau, Quarterly Workforce Indicators (LEHD), release R2026Q3.
Frequently Asked Questions
How many new hires are still there a full quarter later?
In the Census Bureau's Quarterly Workforce Indicators, about half. Of 2024 hires at US private firms, 49.1% stayed through the whole of the following quarter; at firms under 20 employees, 48.5%.
Do small businesses keep fewer of their new hires than large companies?
Not by much. 48.5% of 2024 hires at firms under 20 stayed through the next full quarter, against 49.8% at firms of 500 or more. Every size band was within two points of the others.
Which industries keep the most new hires through the next quarter?
Utilities (64.3%), wholesale trade (62.2%) and manufacturing (59.6%) kept the largest shares of 2024 hires through the next full quarter. Agriculture (25.8%) and administrative and support services (35.9%) kept the smallest.
Has new-hire retention at small businesses changed?
At firms under 20 employees, 43.9% of hires stayed through the next full quarter in 2010, 43.4% in 2019 and 48.5% in 2024, the highest of any year since 2010.
Where does the data come from?
The U.S. Census Bureau's Quarterly Workforce Indicators, built from state unemployment insurance payroll records. National, private sector, by firm size, release R2026Q3. Seasonal and temporary jobs are included.
Published by The Lonely Entrepreneur — the community and coaching platform for entrepreneurs who are building alone. lonelyentrepreneur.com
This article is for educational purposes and is not a substitute for professional financial or legal advice.