

 Founder Data Report
In Mid-2020, Nearly One in Four Hires at Firms Under 20 Employees Was Someone Coming Back
Get clarity — download the free Entrepreneur Survival Guide Summary.
Census job-flow data by firm size: when hiring picked up in mid-2020, the smallest employers rehired past workers at a higher rate than any other size, on top of their ordinary hiring.
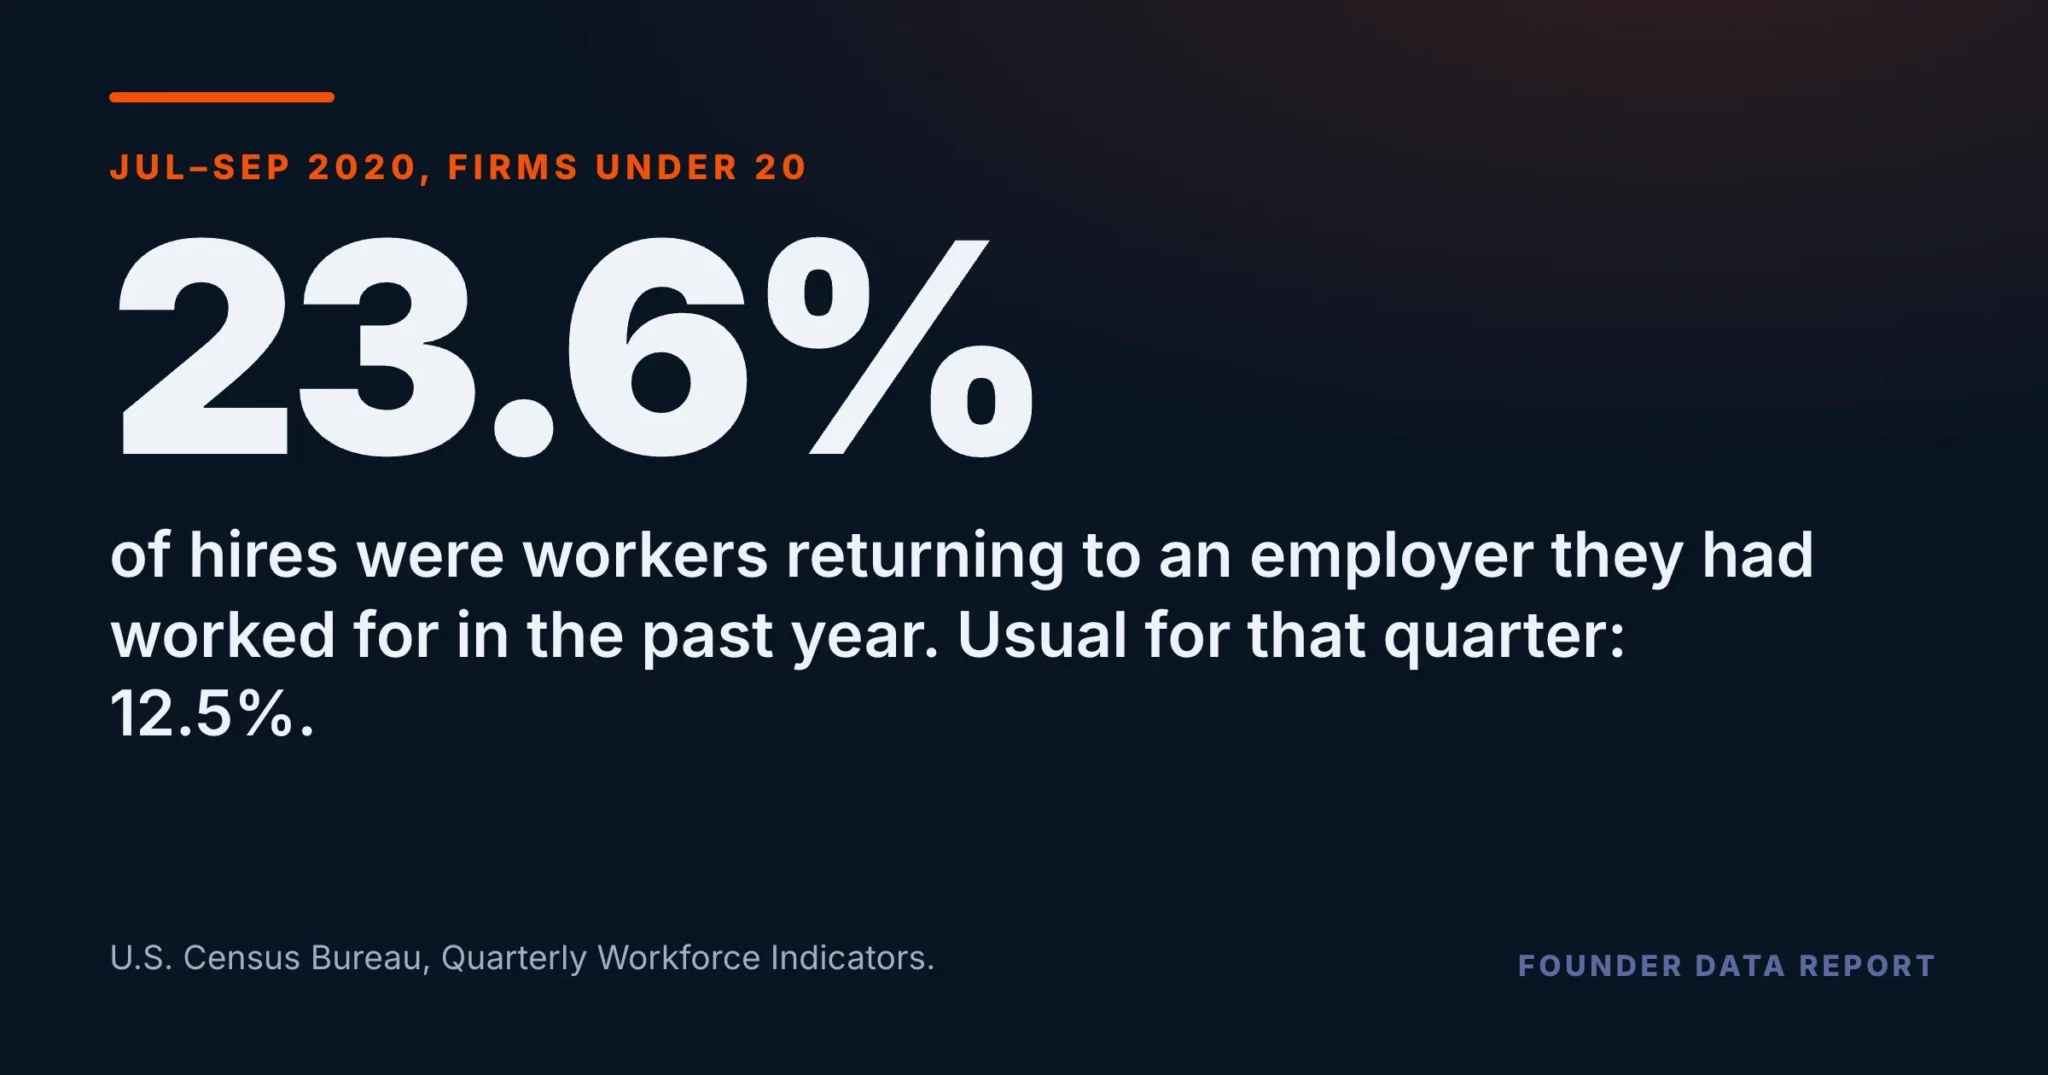
In the Census Bureau’s Quarterly Workforce Indicators, 23.6% of hires at private firms with fewer than 20 employees in July to September 2020 were recall hires: workers returning to an employer they had worked for within the previous year. In an ordinary July to September it was 12.5%. Their recall rate was 6.0 per 100 workers, against a usual 2.8, and their hiring of new people stayed inside its ordinary range.
- July to September 2020: firms under 20 employees made 6.0 recall hires per 100 workers, against a usual 2.8 for that quarter. That is the highest rate of any size.
- Every size rose above its own normal range. At 500 or more employees: 3.1 against a usual 1.7.
- Recall hires were 23.6% of all hires at firms under 20, against a usual 12.5%.
- New hiring at firms under 20 stayed inside its usual range. At every larger size it was below its range.
- In 2008–10, recall rates never rose more than half a point above normal at any size. In 2020 the rate at firms under 20 more than doubled.
What a recall hire is
The Census Bureau’s Quarterly Workforce Indicators split every hire into two kinds. A new hire is someone starting a job with an employer they have not worked for in the past year. A recall hire is, in Census’s words, a worker “who returned to the same employer where they had worked within the previous year.” The data records that the person came back. It does not record why they left, or who made the call. Both are counted per quarter as a rate on average employment, so a firm size with more workers does not look busier just for being bigger. The figures are not seasonally adjusted, so the fair comparison is the same quarter in ordinary years, here the average of 2015 to 2019.
July to September 2020
Across all private firms, recall hires ran at 4.0 per 100 workers in July to September 2020, against a usual 2.0. By size, the rate was highest at the smallest firms and fell with every step up: 6.0 per 100 at fewer than 20 employees, 3.1 at 500 or more. The rise above each size’s own normal followed the same order, from +3.2 points at under 20 to +1.4 at 500 or more. Every size was above the top of its own 2015–2019 range for that quarter, and at firms under 20 the rate more than doubled.
Workers returning to an employer they had worked for within the previous year, per 100 workers of average employment, private sector. Usual = 2015–2019 average for July–September. Track runs from 0 to 7 per 100.
U.S. Census Bureau, Quarterly Workforce Indicators (LEHD), national counts by firm size, private sector, not seasonally adjusted (qwi_us_sa_fs, release R2026Q3), retrieved from lehd.ces.census.gov on October 21, 2026. Usual = 2015–2019 average for the same quarter.
As a share of everyone hired that quarter, returning workers were 23.6% of hires at firms under 20, nearly one in four, against an ordinary 12.5%. At 500 or more employees the share went from 9.5% to 17.0%. In all 19 industry sectors Census publishes, the smallest firms’ share was above the top of its own 2015–2019 range for that quarter.
Recall hires as a percent of all hires in the quarter, private sector. Usual = 2015–2019 average for July–September. All bars on one scale.
U.S. Census Bureau, Quarterly Workforce Indicators (LEHD), national counts by firm size, private sector, not seasonally adjusted (qwi_us_sa_fs, release R2026Q3), retrieved from lehd.ces.census.gov on October 21, 2026. Usual = 2015–2019 average for the same quarter.
When hiring picked up in mid-2020, the smallest employers took back their own past workers at the highest rate.
On top of ordinary hiring, not instead of it
A higher share of returning workers could just mean fewer new people were being hired. In July to September 2020 that was true at every size except the smallest. Firms under 20 hired new people at 19.4 per 100 workers, inside their usual range for that quarter (average 19.6). At every larger size, new hiring was below the bottom of its usual range. So at the smallest firms the returning workers came on top of an ordinary quarter of new hires.
Workers starting a job with an employer they had not worked for within the previous year, per 100 workers of average employment, private sector. Usual = 2015–2019 average for July–September.
U.S. Census Bureau, Quarterly Workforce Indicators (LEHD), national counts by firm size, private sector, not seasonally adjusted (qwi_us_sa_fs, release R2026Q3), retrieved from lehd.ces.census.gov on October 21, 2026. Usual = 2015–2019 average for the same quarter.
The quarter before tells the other half. In April to June 2020, firms under 20 hired new people at 17.2 per 100, against a usual 20.4, while recall hires were 5.1, just below their usual 5.2. April to June is ordinarily the smallest firms’ busiest quarter for returning workers, so that rate was already high. By October to December it was 4.1 per 100, still above its usual 3.4.
Not how 2008 went
In 2008 to 2010, measured against the same quarter in 2005 to 2007, the recall rate never rose more than half a point above normal at any firm size. The share of hires who were returning workers did climb in April to June 2009, by more than four points at every size, but in the same quarter new hiring fell below its 2005–2007 level at every size. Recalls themselves barely moved. In 2020 the recall rate itself more than doubled at the smallest firms.
What to take from this if you run a small one
If you run a business with a handful of people, the people who already know the work are the shortest route back to full strength, and in 2020 small employers used that route at a higher rate than any other size. The data cannot say how. It does not record whether the person was let go, put on leave, or quit and came back, and it does not say who picked up the phone. It does show that the rehiring happened alongside an ordinary quarter of new hiring, not in place of it. The practical question to ask before the next shock: if you had to stop, who would you call first, and would they still pick up?
Three limits worth holding. These are totals for size bands, not the same firms followed over time, so they cannot say whether a given business brought its people back. The figures are not seasonally adjusted, which is why every comparison here is to the same quarter in ordinary years. And they cover private employers only; owners with no employees are outside them.
U.S. Census Bureau, Quarterly Workforce Indicators.
Frequently Asked Questions
What is a recall hire?
In the Census Bureau's Quarterly Workforce Indicators, a recall hire is a worker who returned to the same employer where they had worked within the previous year. It does not record why the person left.
Did small businesses rehire past workers more than large ones in 2020?
Yes, at the rate level. In July to September 2020, firms under 20 employees made 6.0 recall hires per 100 workers, against 3.1 at firms with 500 or more.
What share of small-business hires were returning workers?
23.6% of hires at firms under 20 employees in July to September 2020, against a usual 12.5% for that quarter.
Did rehiring replace new hiring?
Not at the smallest firms. Their new-hire rate, 19.4 per 100 workers, stayed inside its usual range. At every larger size new hiring was below its usual range.
Where does the data come from?
The U.S. Census Bureau's Quarterly Workforce Indicators, built from the Longitudinal Employer-Household Dynamics program: national counts by firm size for private employers, not seasonally adjusted.
Published by The Lonely Entrepreneur — the community and coaching platform for entrepreneurs who are building alone. lonelyentrepreneur.com
This article is for educational purposes and is not a substitute for professional financial or legal advice.