

 Founder Data Report
Half the People Who Own America’s Employer Businesses Are 55 or Older. For Seven in Ten, It Is the Only Paycheck.
Join us Fridays at 12 PM ET to ask TLE CEO Michael Dermer your questions live.
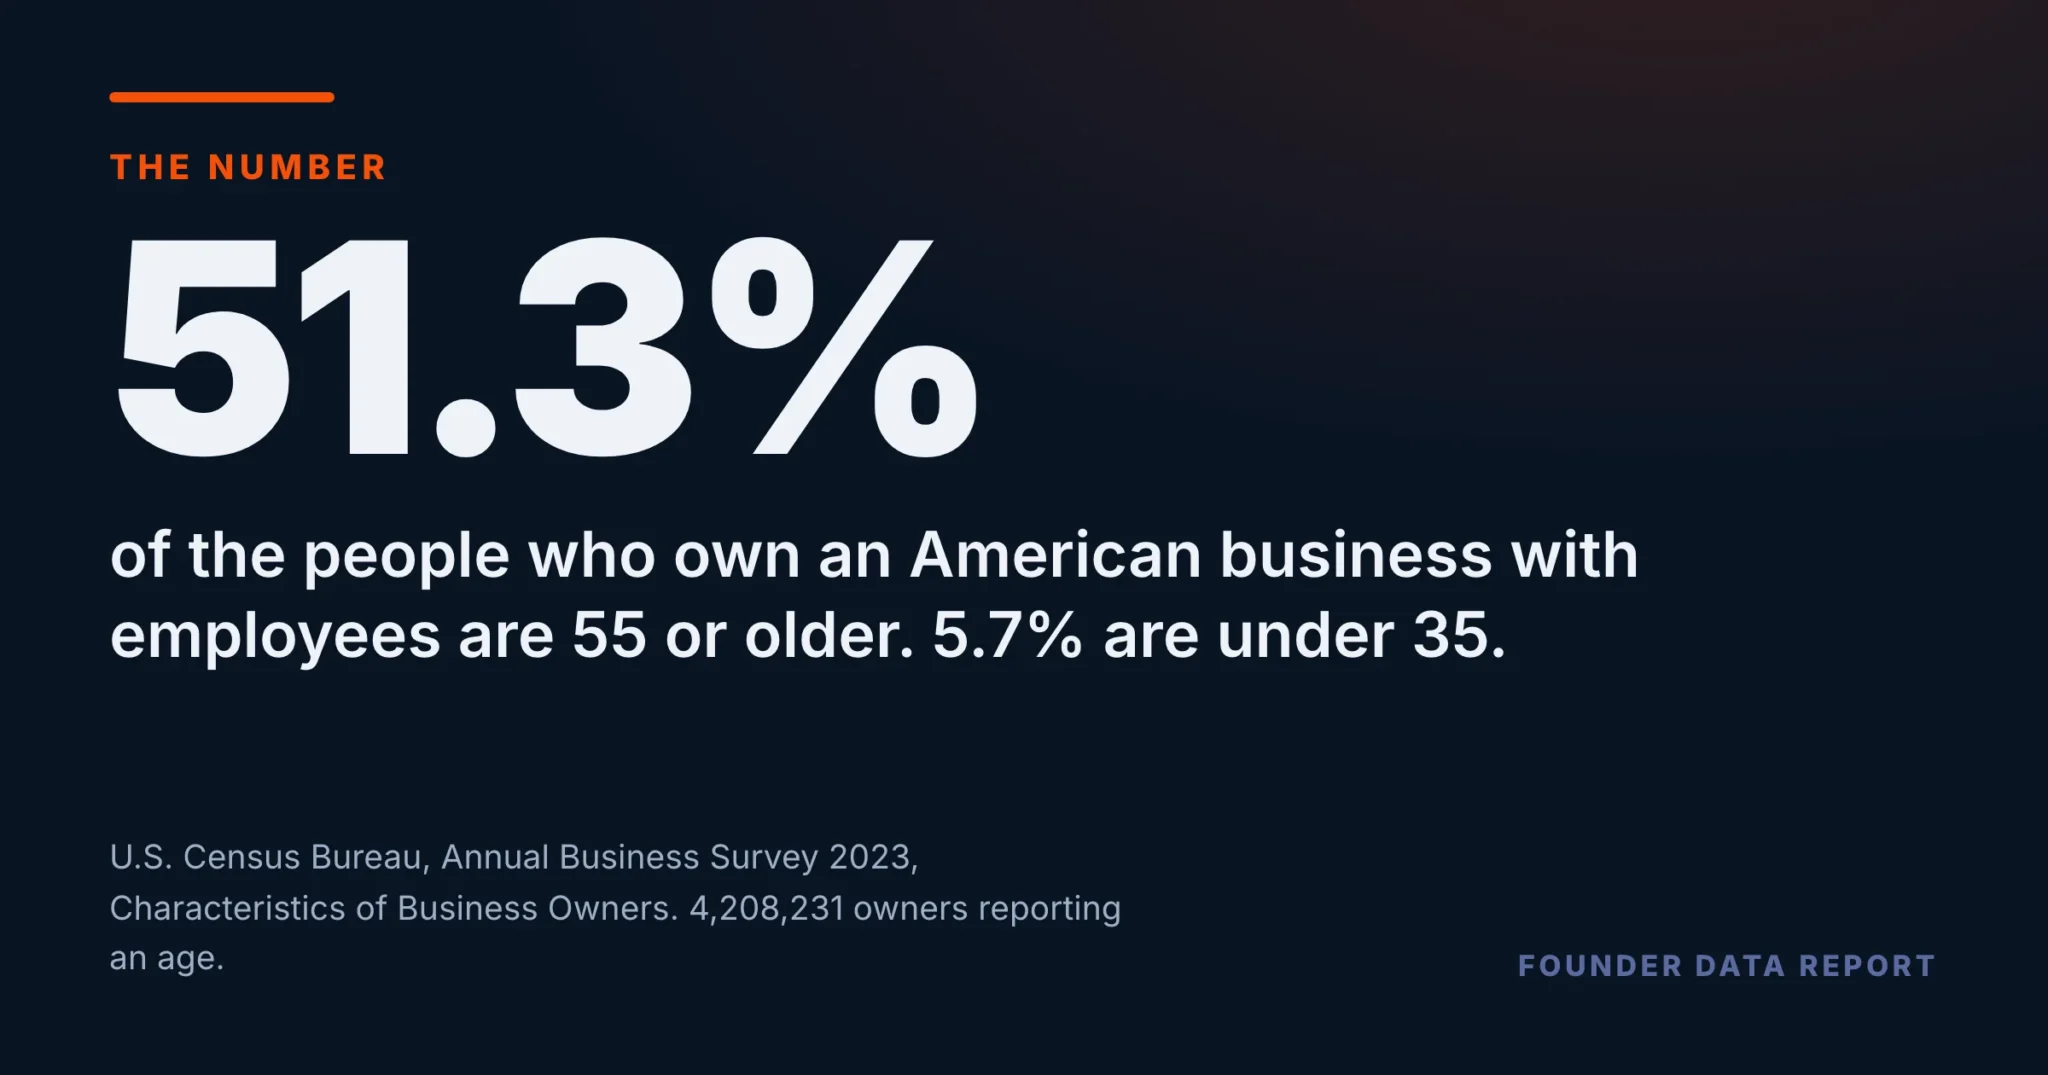
The Census Bureau counted 4.21 million owners of U.S. employer businesses in 2023 and asked each of them their age. 51.3% are 55 or over and 5.7% are under 35 — and that is true in every single industry it publishes.
Of the 4,208,231 owners of U.S. employer businesses who reported an age in 2023, 2,157,838 — 51.3% — are 55 or older. 5.7% are under 35. That is 9.1 older owners for every younger one, and it holds in all 20 published industry sectors without exception. 970,618 of them, 23.1%, are 65 or over. For 72% of owners the business is their primary source of personal income, so the decisions being made in those chairs are being made by people whose own household depends on the answer.
- 51.3% of owners are 55 or older; 5.7% are under 35 — a gap of 45.6 points.
- 970,618 owners are 65 or over, 23.1% of the total.
- The single largest age band is 55 to 64, at 28.2%.
- All 20 sectors hold more owners 55+ than under 35. Across the 19 named industries the range runs from 70.2% down to 42.7%.
- 72.0% say the business is their primary personal income; 43.3% of those who named a year have held it since before 2010.
The distribution is not close
This is not a survey of people who call themselves entrepreneurs. It is a count of the owners of businesses that meet a payroll — 4.21 million of them — and the Census Bureau asks each one their age. The largest single band is 55 to 64 at 28.2%. The band under 25 holds 0.4%. Put the two halves together and 51.3% of the people running America’s employer businesses are 55 or older against 5.7% under 35.
Orange marks the two bands at 55 and over, which together are 51.3% of all owners. Column heights are shares of the 4,208,231 owners who reported an age and the six bands add to 100%. The under-25 column is drawn at the chart’s minimum height and is smaller than it looks — read it from its label, 0.4%.
U.S. Census Bureau, Annual Business Survey 2023, Characteristics of Business Owners, question OWNRAGE, all owners of employer firms.
Every industry, without exception
A national figure like this usually hides an industry that runs the other way. This one does not. In every one of the 20 sectors the Bureau publishes, owners 55 and over outnumber owners under 35 — and not narrowly: the named industry with the fewest older owners, arts, entertainment, and recreation, still has 42.7% of them against 7.8% under 35. Among sectors with more than 100,000 owners, wholesale trade is the oldest at 63.4%.
Bars are drawn on a 0–75% axis, not 0–100. Orange marks a sector at or above the national 51.3%; slate marks one below it. An owner whose firm operates in more than one sector is counted in each, so the sector counts sum to 100.5% of the national total — the rates within each sector are unaffected, but the column must not be added up. “Industries not classified” is a residual group of 1,424 owners, shown for completeness.
U.S. Census Bureau, Annual Business Survey 2023, Characteristics of Business Owners, question OWNRAGE by 2022 NAICS sector. All 20 published sectors, including the ranges 31-33, 44-45 and 48-49.
In all 20 published industries, owners over 55 outnumber owners under 35. There is no sector where the reverse is true.
Why the owners are older than the founders
There is a wrong way to read that chart, and the Bureau publishes the number that blocks it. An owner count is a stock, not a flow: it counts everyone sitting in the chair today, not the age at which they arrived. Ask when they took the business on and the picture fills in — 43.3% of the owners who named a year have held theirs since before 2010, and 39.3% took over between 2010 and 2019. Someone who bought in at 40 in 2006 is in the 55-to-64 band now without anything having changed about who starts businesses.
Bars are drawn on a 0–45% axis, not 0–100. Orange marks the four periods before 2010. Shares are of the 3,608,172 owners who named a year; a further 606,577 owners — 14.4% of those asked — answered “don’t know” and are excluded rather than distributed.
U.S. Census Bureau, Annual Business Survey 2023, Characteristics of Business Owners, question YRACQBUS.
So the age profile is telling you about tenure as much as about demography. What it does establish is the size of the group for whom the succession question is not hypothetical: 970,618 people already past 65 are running businesses that employ other people, and for roughly seven in ten owners the business is the household’s main income rather than a second one.
What this does and does not say
It does not say there is a cliff coming. The survey is a single year and cannot show a trend, it does not ask when anyone intends to stop, and an owner at 65 may well have another fifteen years in the chair. Nor does it say young people are not starting businesses — new firms are a flow this stock cannot see, and a business founded last year by a 30-year-old is one owner among 4.21 million here.
What it does say is who is actually carrying the decisions right now. The median owner of an American business with employees is closer to retirement than to their first job, has held the business for more than a decade, and depends on it for the household income. Those three facts sit behind a great many conversations about pricing, hiring and whether to take the risk — and they are the same three facts in every industry.
U.S. Census Bureau, Annual Business Survey 2023, Characteristics of Business Owners, questions OWNRAGE, PRIMINC and YRACQBUS. Tenure share is of owners who named a year.
Frequently Asked Questions
What is the average age of a small business owner in the United States?
The Census Bureau publishes bands rather than an average. In 2023, 51.3% of the 4,208,231 owners of U.S. employer businesses were 55 or older and 5.7% were under 35. The largest single band was 55 to 64, at 28.2%.
How many U.S. business owners are over 65?
970,618, or 23.1% of all owners of employer businesses.
Are business owners older in some industries than others?
The level varies — from 70.2% aged 55+ in management of companies and enterprises down to 42.7% in arts, entertainment, and recreation — but the direction does not. All 20 published sectors have more owners 55 and over than under 35.
Do most owners rely on the business for their income?
Yes. 72.0% of owners told the 2023 survey the business was their primary source of personal income.
Does an older owner population mean fewer people are starting businesses?
Not by itself. An owner count is a stock, not a flow: 43.3% of owners who named a year have held the business since before 2010, so much of the age profile reflects how long people stay rather than how old they were when they began.
Published by The Lonely Entrepreneur — the community and coaching platform for entrepreneurs who are building alone. lonelyentrepreneur.com
This article is for educational purposes and is not a substitute for professional financial or legal advice.