

 Founder Data Report
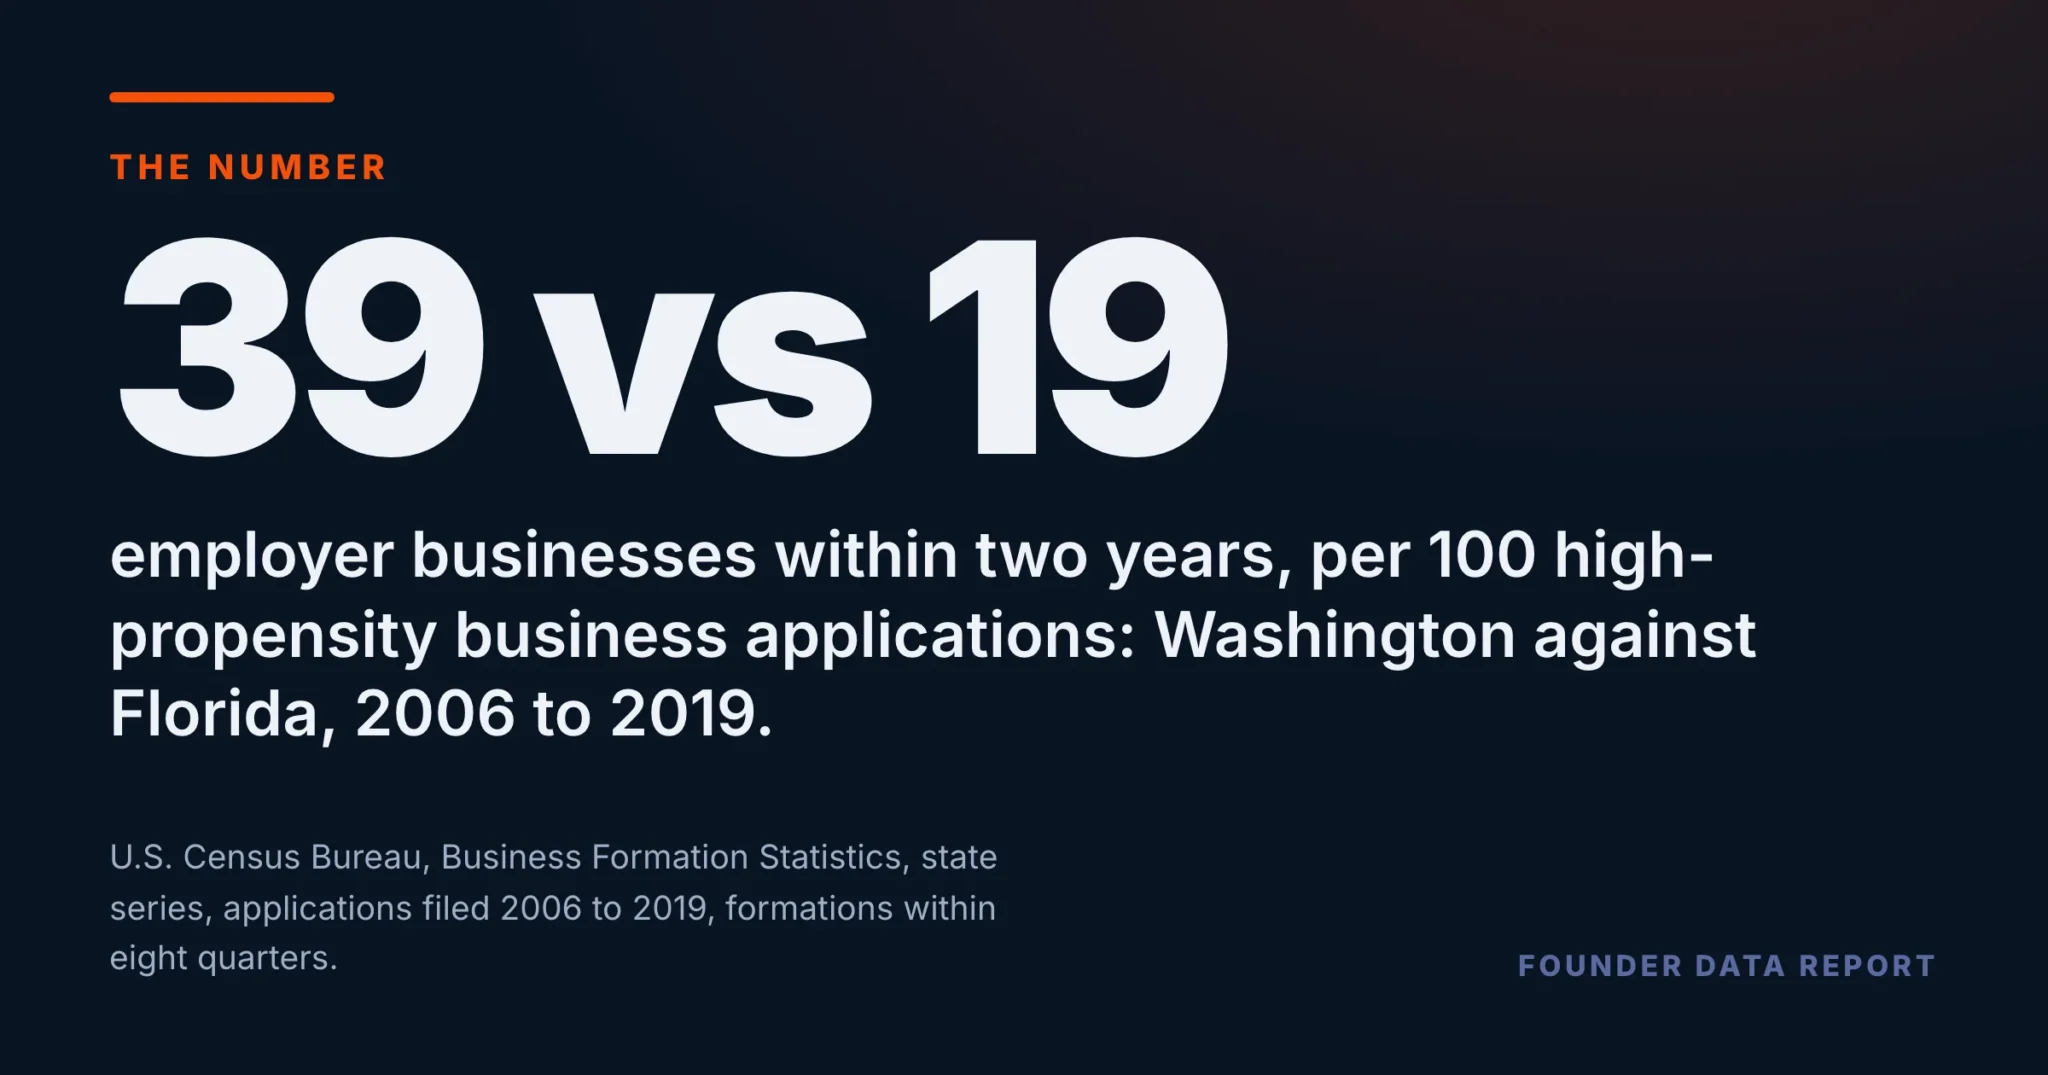
Washington Gets 39 New Employers From Every 100 Likely-to-Hire Business Filings. Florida Gets 19. One Line on the Form Tracks the Gap.
You can’t afford to risk your business without a Sidekick at your side.
The Census Bureau follows every business application through to the first wage it pays, state by state. Among the filings it flags as likely to hire, the number that reach a payroll, per filing, is about twice as high in the Pacific Northwest as in Florida — every year for fourteen years. Most of that gap lines up with one decision the founder writes down on the day they file.
For business applications filed from 2006 to 2019, Washington produced 39.4 employer businesses within two years for every 100 applications the Census Bureau flags as likely to hire. Florida produced 19.1. The national figure is 28.2. The gap is not one bad year: in every one of the 14 years, the highest state turned at least 1.9 times as many of these filings into a payroll as the lowest, and Florida was the lowest every time. Across 33 states, the rate rises and falls with one thing the founder writes on the form — whether they name a date they will pay their first wage.
- Pooling applications filed 2006 to 2019, the rate runs from 19.1 employers per 100 high-propensity filings in Florida to 39.4 in Washington. Oregon and Idaho sit just behind Washington; Georgia and Maryland just ahead of Florida.
- Six states were in the lowest ten of the 33 in all 14 years and four were in the highest ten in all 14.
- Across the 33 states, the rate tracks the share of high-propensity filings that name a first-wages date: correlation 0.77. It does not track the share filed by corporations, which runs the other way at -0.40.
- For the latest cohort the Bureau can count, 2021, every one of these states is lower than in 2019, and the order barely moves (rank correlation 0.91).
- 17 states and DC are left out because the Bureau withholds at least one of their months in the window. Nothing here says a state’s laws or economy caused its rate.
Twice the payrolls from the same kind of filing
Every business application in America is an EIN filing, and the Census Bureau sorts out the ones most likely to become employers. It calls them high-propensity: the application comes from a corporation, says it is hiring, gives a first wages-paid date, or sits in manufacturing, retail stores, health care or restaurants. Our earlier piece on filing versus starting showed that nationally, those filings turn into employers at a steady rate even as the total number of applications has doubled. Cut by state, that steady national rate turns out to be an average of very different places. For applications filed 2006 to 2019, Washington produced 39.4 employer businesses within eight quarters per 100 high-propensity filings, Oregon 37.7 and Idaho 37.2. Florida produced 19.1, Georgia 22.6 and Maryland 22.8.
The six lowest and six highest of the 33 states with every month published for 2006 to 2019, with the national figure between them. Bars sit on a 0 to 45 scale and the printed figures are the true ones. Slate marks the lowest six and orange the highest six; the national bar is amber. The colours name the group, not a verdict on the state.
U.S. Census Bureau, Business Formation Statistics, monthly state series (bfs_monthly.csv), downloaded from census.gov/econ/bfs/ on October 2, 2026. Business formations are counted within eight quarters of the month the application was filed, so each year’s formations and applications are the same cohort. Series BF_BF8Q and BA_HBA, applications filed January 2006 to December 2019, summed by state.
In all 14 years, Florida was the lowest. The gap to the top never fell below 1.9 to one.
Not a bad year, a standing order
A two-to-one gap in one year could be noise. This one is the same gap every year. Ranking the 33 states separately for each year from 2006 to 2019, the highest rate was between 1.93 and 2.27 times the lowest. Florida was last in all 14; the top spot went to Idaho or Washington every year. Florida, Georgia, Illinois, Louisiana, Maryland and Michigan sat in the lowest ten every year, and California, Idaho, Oregon and Washington in the highest ten. The 2006 order and the 2019 order have a rank correlation of 0.79. The latest cohort the Bureau can count is 2021, two years of payroll records later: every one of these states converted fewer of its filings than in 2019 as the pandemic filing surge swelled the count, and the order still held at 0.91.
Each state’s rate is ranked against the other 32 separately for every year from 2006 to 2019. Shown are the states that held the same group in every one of the 14 years. Slate is the lowest ten and orange the highest ten. Tennessee was in the lowest ten in 13 of 14 years and Missouri in the highest ten in 13; neither is shown.
U.S. Census Bureau, Business Formation Statistics, monthly state series (bfs_monthly.csv), downloaded from census.gov/econ/bfs/ on October 2, 2026. Business formations are counted within eight quarters of the month the application was filed, so each year’s formations and applications are the same cohort. Series BF_BF8Q and BA_HBA, each application year from 2006 to 2019.
The line on the form that lines up with the gap
High-propensity is a wide net. A filing qualifies if it is a corporation, whether or not it ever plans to hire, and a filing qualifies if it names the date it will pay its first wage. Those are not the same kind of signal, and the state mix of them differs a lot. In Florida, 65% of high-propensity filings came from corporations and only 32.0% named a first-wages date. In Washington, the wages-date share was 57.5%. Across all 33 states, the payroll rate rises with the wages-date share — a correlation of 0.77, and still 0.77 with Florida and New York, the two lowest shares, taken out. It falls as the corporate share rises (-0.40). Split into thirds by payroll rate, the median wages-date share is 44.6% among the lowest-rate eleven states and 52.4% among the highest-rate eleven. Nationally, our earlier piece found that founders who name a wages date follow through about two times in three. State by state, the places where more founders write that date down are the places where more filings become employers.
The 33 states are split into thirds by their 2006 to 2019 payroll rate and each row shows two medians across its 11 states, taken separately for each measure. A median is used rather than pooling the third into one total, because pooling lets California’s size outweigh the ten states it is grouped with. Both bars in a row are drawn on the same 0 to 60 scale; the printed figures are the true ones. Slate is the share of high-propensity filings naming a first-wages date and orange is employer businesses within two years per 100 of those filings. The colours name the measure, not a verdict.
U.S. Census Bureau, Business Formation Statistics, monthly state series (bfs_monthly.csv), downloaded from census.gov/econ/bfs/ on October 2, 2026. Business formations are counted within eight quarters of the month the application was filed, so each year’s formations and applications are the same cohort. Series BA_WBA, BA_HBA and BF_BF8Q, summed over the window for each state.
What this means if you are filing
The state you live in is not the lesson. Nothing in this data says Florida makes it harder to hire or Washington makes it easier; the filter that decides which applications count as high-propensity also picks up a state’s industry mix and its habits about incorporating, and the state file does not cross state with industry, so the two cannot be pulled apart here. What the data does show is that a payroll is a decision before it is a result. The founders who write down when they will pay their first wage are, on the record, the ones whose filings most often become employers, and the states with more of those founders get more payrolls from the same kind of filing. If hiring is part of the plan, the date belongs on the plan — not because the IRS form makes it happen, but because a business that has picked the date has usually already done the arithmetic behind it. Three limits. These are filings, not people, and one founder can file more than once. The wages-date link is a correlation across states, not a test of any one business. And 17 states and DC are missing because the Bureau withholds at least one of their months between 2006 and 2019, mostly smaller states, from Alaska to Wyoming.
U.S. Census Bureau, Business Formation Statistics, monthly state series (bfs_monthly.csv), downloaded from census.gov/econ/bfs/ on October 2, 2026. Business formations are counted within eight quarters of the month the application was filed, so each year’s formations and applications are the same cohort.
Frequently Asked Questions
Which states turn the most business applications into employers?
Among the 33 states with every month published from 2006 to 2019, Washington, Oregon and Idaho produced the most employer businesses within two years per 100 high-propensity applications — 39.4, 37.7 and 37.2. Florida, Georgia and Maryland produced the fewest: 19.1, 22.6 and 22.8. The national figure is 28.2.
Is it harder to start an employer business in Florida?
This data cannot say that. Florida had the lowest rate in all 14 years, but its high-propensity filings are among the most likely of the 33 states to come from corporations (65%) and among the least likely to name a first-wages date (32.0%). The gap lines up with what founders write on the form, not with anything the data measures about the state itself.
What is a high-propensity business application?
The Census Bureau's own filter for EIN applications likely to become employers. A filing qualifies if it comes from a corporation, indicates it is hiring, gives a first wages-paid date on IRS Form SS-4, or is in manufacturing, retail stores, health care or restaurants and food service.
Why stop at 2021?
A formation is counted if the business pays a wage within eight quarters of the month it applied, so the count for an application year is only complete two years later. The Bureau publishes projections for later years; this article uses actual counts only.
Why are some states missing?
The Bureau withholds a state's monthly figure when publishing it could identify a business. 17 states and DC have at least one withheld month between 2006 and 2019, so their annual totals would be incomplete. They are left out rather than estimated.
Published by The Lonely Entrepreneur — the community and coaching platform for entrepreneurs who are building alone. lonelyentrepreneur.com
This article is for educational purposes and is not a substitute for professional financial or legal advice.