

 Founder Data Report
In 2010, Workplaces Under 10 Still Had a Layoff Rate 13% Above 2007. Every Size From 50 Up Was Already Below Its 2007 Rate
Get clarity — download the free Entrepreneur Survival Guide Summary.
The layoffs at big workplaces fell back fast once 2009 was over. At the smallest ones they did not. Here is what the federal turnover survey shows about who was still cutting a year later.
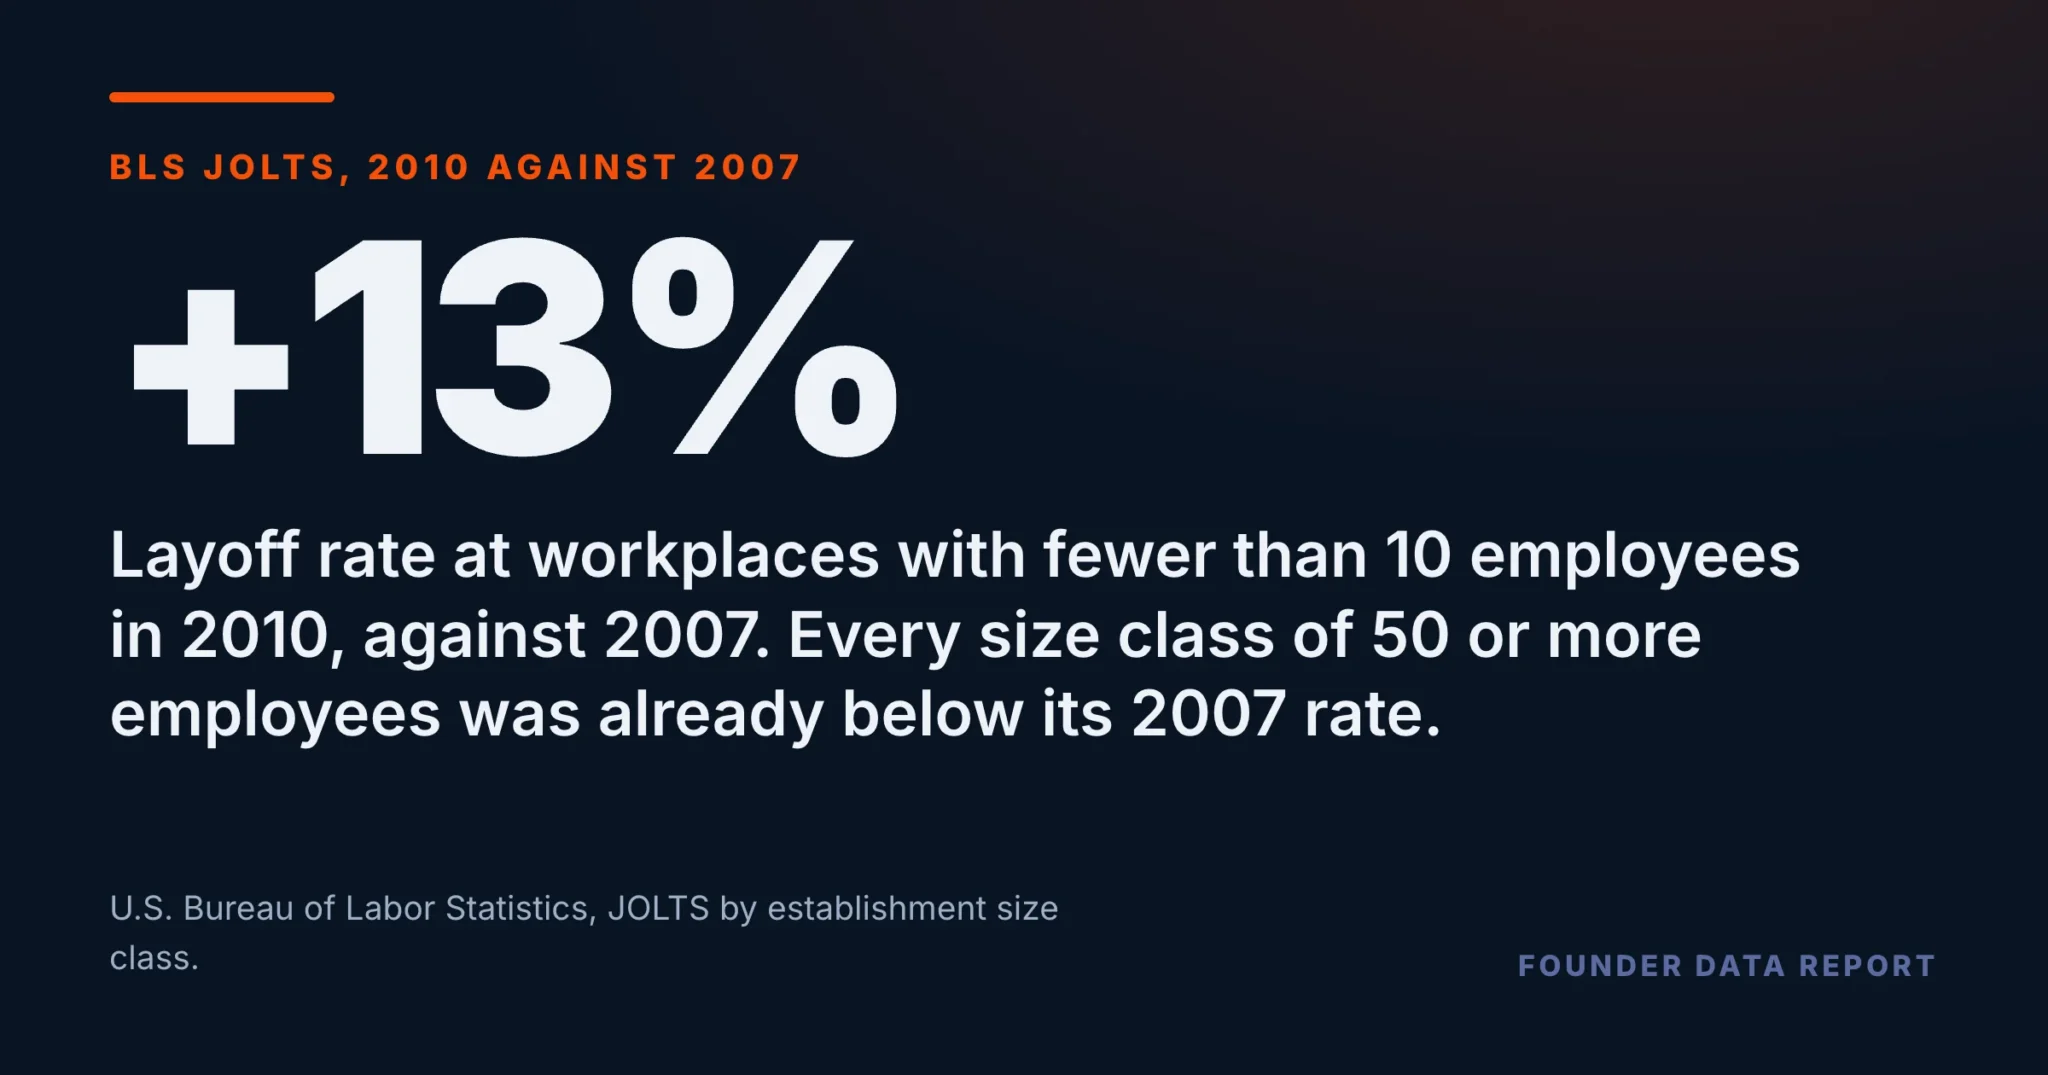
In the Bureau of Labor Statistics’ Job Openings and Labor Turnover Survey, workplaces with fewer than 10 employees laid people off at an average of 1.94 per 100 jobs a month in 2010, 13% above their 2007 rate of 1.71. Every size class of 50 employees or more was already below its own 2007 rate that year, and so was the private sector as a whole. The smallest workplaces did not get back to about their 2007 layoff rate until 2011.
- Layoff rate in 2010 against 2007: fewer than 10 employees 113%; 10 to 49 104%; 50 to 249 91%; 250 to 999 93%; 1,000 to 4,999 95%.
- In 9 of the 12 months of 2010, the under-10 layoff rate was above the same month of 2007. For every size of 50 or more it was three months or fewer.
- Hiring held up best at the smallest workplaces: 94% of the 2007 hiring rate in 2010, against 56% to 87% for every other size.
- Quits at the smallest workplaces kept falling in 2010, from 1.68 to 1.54 per 100 jobs a month, while quits rose at every size from 10 to 4,999.
- Rates only, total private, not seasonally adjusted; the survey does not say why owners did what they did.
The year after the peak
Layoffs in the private sector peaked in 2009. The Bureau of Labor Statistics measures them every month in the Job Openings and Labor Turnover Survey (JOLTS), and it publishes the rates by the size of the workplace: an establishment, one location, sorted by its highest employment over the year before. That lets you ask a question the headline numbers hide. When the cutting stopped, did it stop everywhere at once?
It did not. In 2010 the private sector as a whole laid people off at 1.56 per 100 jobs a month, already a little below its 2007 rate of 1.61. Every size class of 50 employees or more was below its own 2007 rate too. The one clear exception was the smallest workplaces. With fewer than 10 employees, the layoff rate in 2010 was 1.94, against 1.71 in 2007: still 13% higher, a full year after the peak. Workplaces with 10 to 49 employees sat just above their 2007 rate, at 1.69 against 1.62.
Annual average of the twelve monthly rates, total private, not seasonally adjusted. The track runs from 0 to 2.5 per 100 jobs. Every size class of 50 employees or more sits lower in 2010 than in 2007; the under-10 class sits higher.
U.S. Bureau of Labor Statistics, Job Openings and Labor Turnover Survey (JOLTS), layoffs and discharges, hires and quits by establishment size class, total private, not seasonally adjusted, 2006-2015, retrieved from the BLS public data API on October 27, 2026. Rates are annual means of the twelve monthly rates. Size class is set by a workplace’s highest employment over the prior 12 months and held for a year.
More than a few bad months
The smallest size class is also the noisiest. Its monthly rates are published to one decimal place and jump around the start of each quarter, so a yearly average can be pulled by a few odd months. A simpler test is to compare each month of 2010 with the same month of 2007, which takes the seasons out.
On that test the pattern holds. At workplaces under 10, the layoff rate was higher than in the same month of 2007 in 9 of the 12 months of 2010. For every size class of 50 or more it was higher in three months or fewer, and for the private sector as a whole in two. In 2007 the under-10 rate and the 50-to-249 rate were about level, 1.71 against 1.76. In 2010 the gap between them was 0.33 per 100 jobs a month.
Annual average of the twelve monthly rates, not seasonally adjusted. The axis starts at zero. The under-10 rate was about level with 2007 in 2011 and 2012, and below it from 2013.
U.S. Bureau of Labor Statistics, Job Openings and Labor Turnover Survey (JOLTS), layoffs and discharges, hires and quits by establishment size class, total private, not seasonally adjusted, 2006-2015, retrieved from the BLS public data API on October 27, 2026. Rates are annual means of the twelve monthly rates. Size class is set by a workplace’s highest employment over the prior 12 months and held for a year.
When the cutting stopped at the big workplaces, it had not stopped at the small ones.
The other side: hiring held, and people stayed put
Layoffs are only one side of it. The same survey shows the smallest workplaces kept hiring closer to their 2007 pace than any other size class. In 2010 the under-10 hiring rate was 94% of its 2007 level. Every other size class was between 56% and 87%. The smallest workplaces stayed nearest their 2007 hiring rate in 2011 and 2012 as well, and in 2012 were at 97% of it. None of the size classes under 1,000 employees got back to its 2007 hiring rate in any year through 2015.
Quits moved the other way. At workplaces under 10, the quit rate kept falling in 2010, from 1.68 to 1.54 per 100 jobs a month, while every size class from 10 to 4,999 saw quits pick up. So in the year after the peak, the smallest workplaces had a higher layoff rate than in 2007, a hiring rate close to their 2007 one, and a falling quit rate.
Each bar is the 2010 annual average hiring rate divided by the 2007 annual average, for the same size class. Rates, not head counts: size classes are reset each year, so counts are not comparable across years.
U.S. Bureau of Labor Statistics, Job Openings and Labor Turnover Survey (JOLTS), layoffs and discharges, hires and quits by establishment size class, total private, not seasonally adjusted, 2006-2015, retrieved from the BLS public data API on October 27, 2026. Rates are annual means of the twelve monthly rates. Size class is set by a workplace’s highest employment over the prior 12 months and held for a year.
What to take from this if you run a small one
If you run a business of a few people, the end of a downturn in the headlines is not the end of it in your building. In the last one, the smallest workplaces went on letting people go at a higher rate for a year after the bigger ones had stopped, while still hiring and seeing fewer of their people quit. A plan that assumes your recovery will run on the same calendar as the national numbers was not borne out for workplaces this size.
Three limits worth holding. JOLTS counts workplaces, not companies: a location with six staff may belong to a large firm. The figures are rates, not head counts: each workplace’s size class is reset every year; and the BLS publishes no margins of error for them, so close values are not ranked here. And the survey measures what happened, not why: it cannot say what owners were thinking when they cut, hired or held on.
U.S. Bureau of Labor Statistics, JOLTS by establishment size class, total private, not seasonally adjusted, 2007 and 2010.
Frequently Asked Questions
Did small businesses keep laying people off after the 2008-09 recession?
Workplaces with fewer than 10 employees did. Their layoff rate in 2010 averaged 1.94 per 100 jobs a month, 13% above 2007, while every size class of 50 or more was below its 2007 rate, according to the BLS Job Openings and Labor Turnover Survey.
When did layoffs at the smallest workplaces get back to normal after 2009?
Their layoff rate was about level with 2007 in 2011 and 2012 (1.74 and 1.74 against 1.71) and below it from 2013.
Did small workplaces stop hiring after the recession?
No. In 2010 workplaces under 10 hired at 94% of their 2007 rate, the closest of any size class; the others were between 56% and 87%.
Is a JOLTS size class the same as a company size?
No. JOLTS sorts establishments, single locations, by their highest employment over the previous 12 months. A small location can belong to a large company.
Where does the data come from?
The U.S. Bureau of Labor Statistics' Job Openings and Labor Turnover Survey, layoffs and discharges, hires and quits by establishment size class, total private, not seasonally adjusted, 2006 to 2015, from the BLS public data API.
Published by The Lonely Entrepreneur — the community and coaching platform for entrepreneurs who are building alone. lonelyentrepreneur.com
This article is for educational purposes and is not a substitute for professional financial or legal advice.