

 Founder Data Report
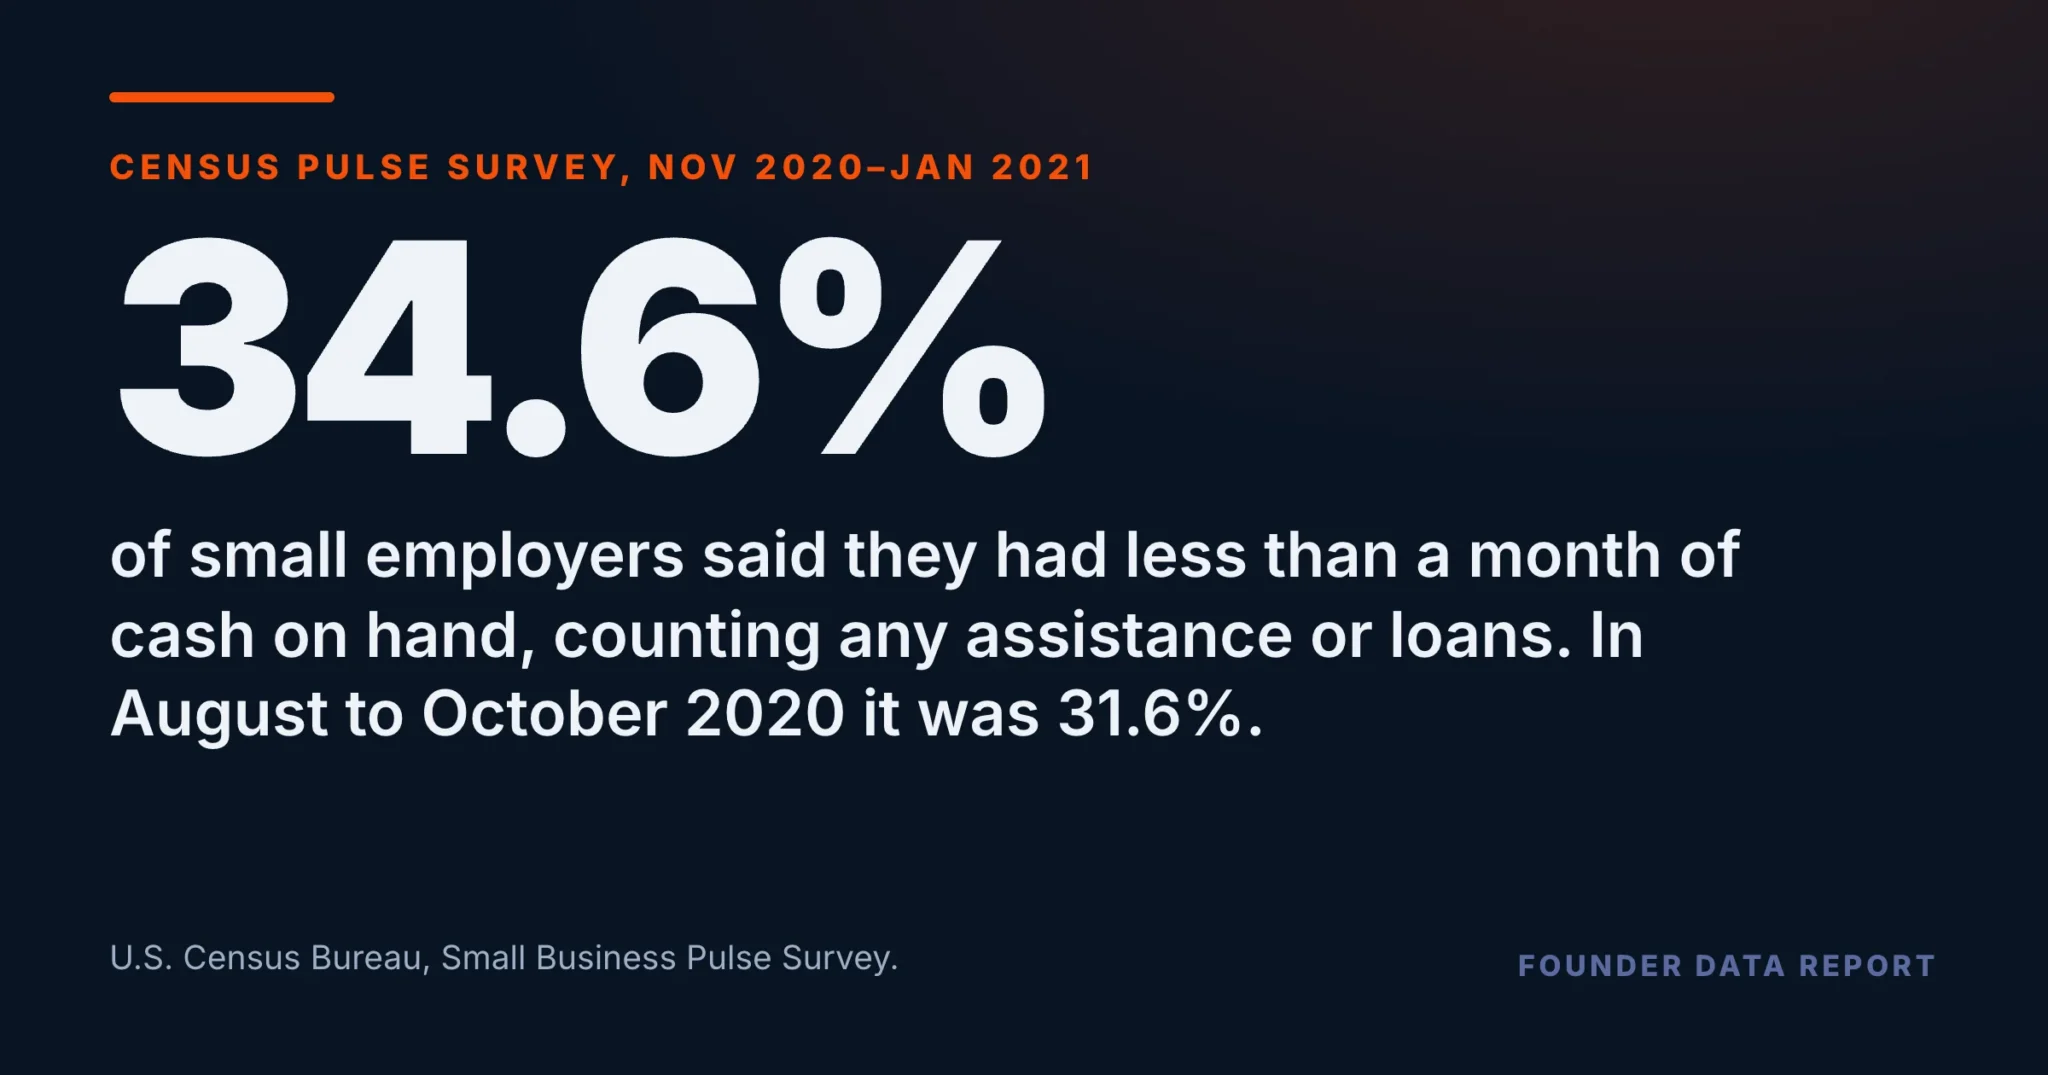
Resilience Measured in Weeks: In Late 2020, 34.6% of Small Employers Had Less Than a Month of Cash on Hand
Join us Fridays at 12 PM ET to ask TLE CEO Michael Dermer your questions live.
How long could your business keep operating on the cash it has? Through the 2020 shock, the Census Bureau asked small employers exactly that, week after week. About one in three said less than a month, and the share grew as the year ended.
In the Census Bureau’s Small Business Pulse Survey, 34.6% of small employers said in November 2020 to January 2021 that they had less than a month of cash on hand to keep operating, counting any financial assistance or loans. In August to October 2020 it was 31.6%. The share with three months or more fell from 27.8% to 25.0%, and the share running short rose in every size class the survey reports.
Resilience is easy to talk about as an attitude. The Census Bureau measured one piece of it in plain units: how many weeks a business could keep operating on the cash it had. That number is the runway an owner has to work with when sales stop, and through the 2020 shock about one in three small employers put theirs under a month.
The question was asked of small employers every week for most of 2020. Two stretches of nine weeks each cover the whole sample the same way, which makes them the fair comparison: late summer and early fall 2020, and the turn of the year.
- In November 2020 to January 2021, 34.6% of small employers had less than a month of cash on hand, counting any assistance or loans. In August to October 2020 it was 31.6%.
- The share with three months or more fell over the same stretch, from 27.8% to 25.0%.
- The share with less than a month rose at firms with 1 to 4 employees, 5 to 19, and 20 or more.
- At firms with 1 to 4 employees, 6.3% said they had no cash available at all, more than twice the 2.9% at firms with 20 or more.
- About one in seven (14.4%) said they did not know. The survey does not say why cash on hand fell.
How long the cash would last
The survey asked owners to describe their cash on hand in units of time: one to seven days of operations, one to two weeks, three to four weeks, one to two months, three months or more, none at all, or don’t know. The question counted any financial assistance or loans the business held.
In November 2020 to January 2021, the answers broke down this way. 34.6% had less than a month: 4.3% had no cash available, 5.6% had one to seven days, 9.2% had one to two weeks and 15.5% had three to four weeks. 25.9% had one to two months, 25.0% had three months or more, and 14.4% did not know.
Share of small employers giving each answer, average of nine weekly rounds. ‘Less than a month’ combines no cash, one to seven days, one to two weeks and three to four weeks of operations.
U.S. Census Bureau, Small Business Pulse Survey, national, by employment size: ‘How would you describe the current availability of cash on hand for this business, including any financial assistance or loans?’ Average of nine weekly rounds per period (August 9–October 12, 2020; November 9, 2020–January 10, 2021). Nonfarm single-location employers with 1 to 499 employees.
The runway got shorter as 2020 ended
Between the two stretches, the share of small employers with less than a month of cash rose from 31.6% to 34.6%, and the share with three months or more fell from 27.8% to 25.0%. Both moves are larger than the survey’s margin of error, and the same nine slices of the sample answered in each stretch.
The survey does not say why. It records how much cash owners said they had, not where it went. What it does show is that the cushion thinned on both ends at once: more businesses near the edge, fewer with a deep reserve.
Share of small employers, average of nine weekly rounds per period. Both bars on one scale, 0 to 100%. The question counted any financial assistance or loans.
U.S. Census Bureau, Small Business Pulse Survey, national, by employment size: ‘How would you describe the current availability of cash on hand for this business, including any financial assistance or loans?’ Average of nine weekly rounds per period (August 9–October 12, 2020; November 9, 2020–January 10, 2021). Nonfarm single-location employers with 1 to 499 employees.
About one in three small employers had less than a month of cash to keep the doors open.
Every size class, and the smallest at the edge
The share with less than a month rose in all three size classes. At firms with 1 to 4 employees it went from 32.5% to 34.9%; at 5 to 19, from 32.6% to 36.2%; and at 20 or more, from 28.7% to 31.9%. In late summer the two smaller classes were level with each other; by the turn of the year, firms with 5 to 19 employees were the most likely of the three to be under a month.
The smallest firms were the most likely to have nothing at all. In November 2020 to January 2021, 6.3% of firms with 1 to 4 employees said they had no cash available for operations, against 2.9% at firms with 20 or more.
Share of small employers in each size class, average of nine weekly rounds per period. Both bars on one scale, 0 to 100%.
U.S. Census Bureau, Small Business Pulse Survey, national, by employment size: ‘How would you describe the current availability of cash on hand for this business, including any financial assistance or loans?’ Average of nine weekly rounds per period (August 9–October 12, 2020; November 9, 2020–January 10, 2021). Nonfarm single-location employers with 1 to 499 employees.
What to take from this if you run one
Resilience has a number attached to it, and it is worth knowing yours before anything goes wrong. If sales stopped tomorrow, how many weeks could you cover payroll, rent and suppliers from the cash you hold? In late 2020, about a third of small employers would have answered under a month, and about one in seven could not answer at all.
Three limits worth holding. The figures describe 2020 and early 2021, a shock unlike most. The survey covers single-location employers with 1 to 499 employees, not businesses without staff. And the first three weekly rounds asked the question without counting assistance or loans, so they are left out here.
U.S. Census Bureau, Small Business Pulse Survey.
Frequently Asked Questions
How much cash did small businesses have during 2020?
In the Census Bureau's Small Business Pulse Survey, 34.6% of small employers said in November 2020 to January 2021 that they had less than a month of cash on hand, counting any assistance or loans. 25.0% had three months or more.
Did it get better or worse as the year went on?
Worse. The share with less than a month rose from 31.6% in August to October 2020 to 34.6% in November 2020 to January 2021, and the share with three months or more fell.
Were the smallest businesses the most exposed?
They were the most likely to have no cash at all: 6.3% of firms with 1 to 4 employees, against 2.9% at 20 or more. On less than a month, firms with 5 to 19 employees were highest by the turn of the year, at 36.2%.
Does the survey say why cash ran low?
No. It records how many weeks or months of operations owners said their cash would cover, not where the money went.
Where does the data come from?
The U.S. Census Bureau's Small Business Pulse Survey, a weekly survey of single-location employers with 1 to 499 employees that ran from April 2020 to April 2022.
Published by The Lonely Entrepreneur — the community and coaching platform for entrepreneurs who are building alone. lonelyentrepreneur.com
This article is for educational purposes and is not a substitute for professional financial or legal advice.