

 Founder Data Report
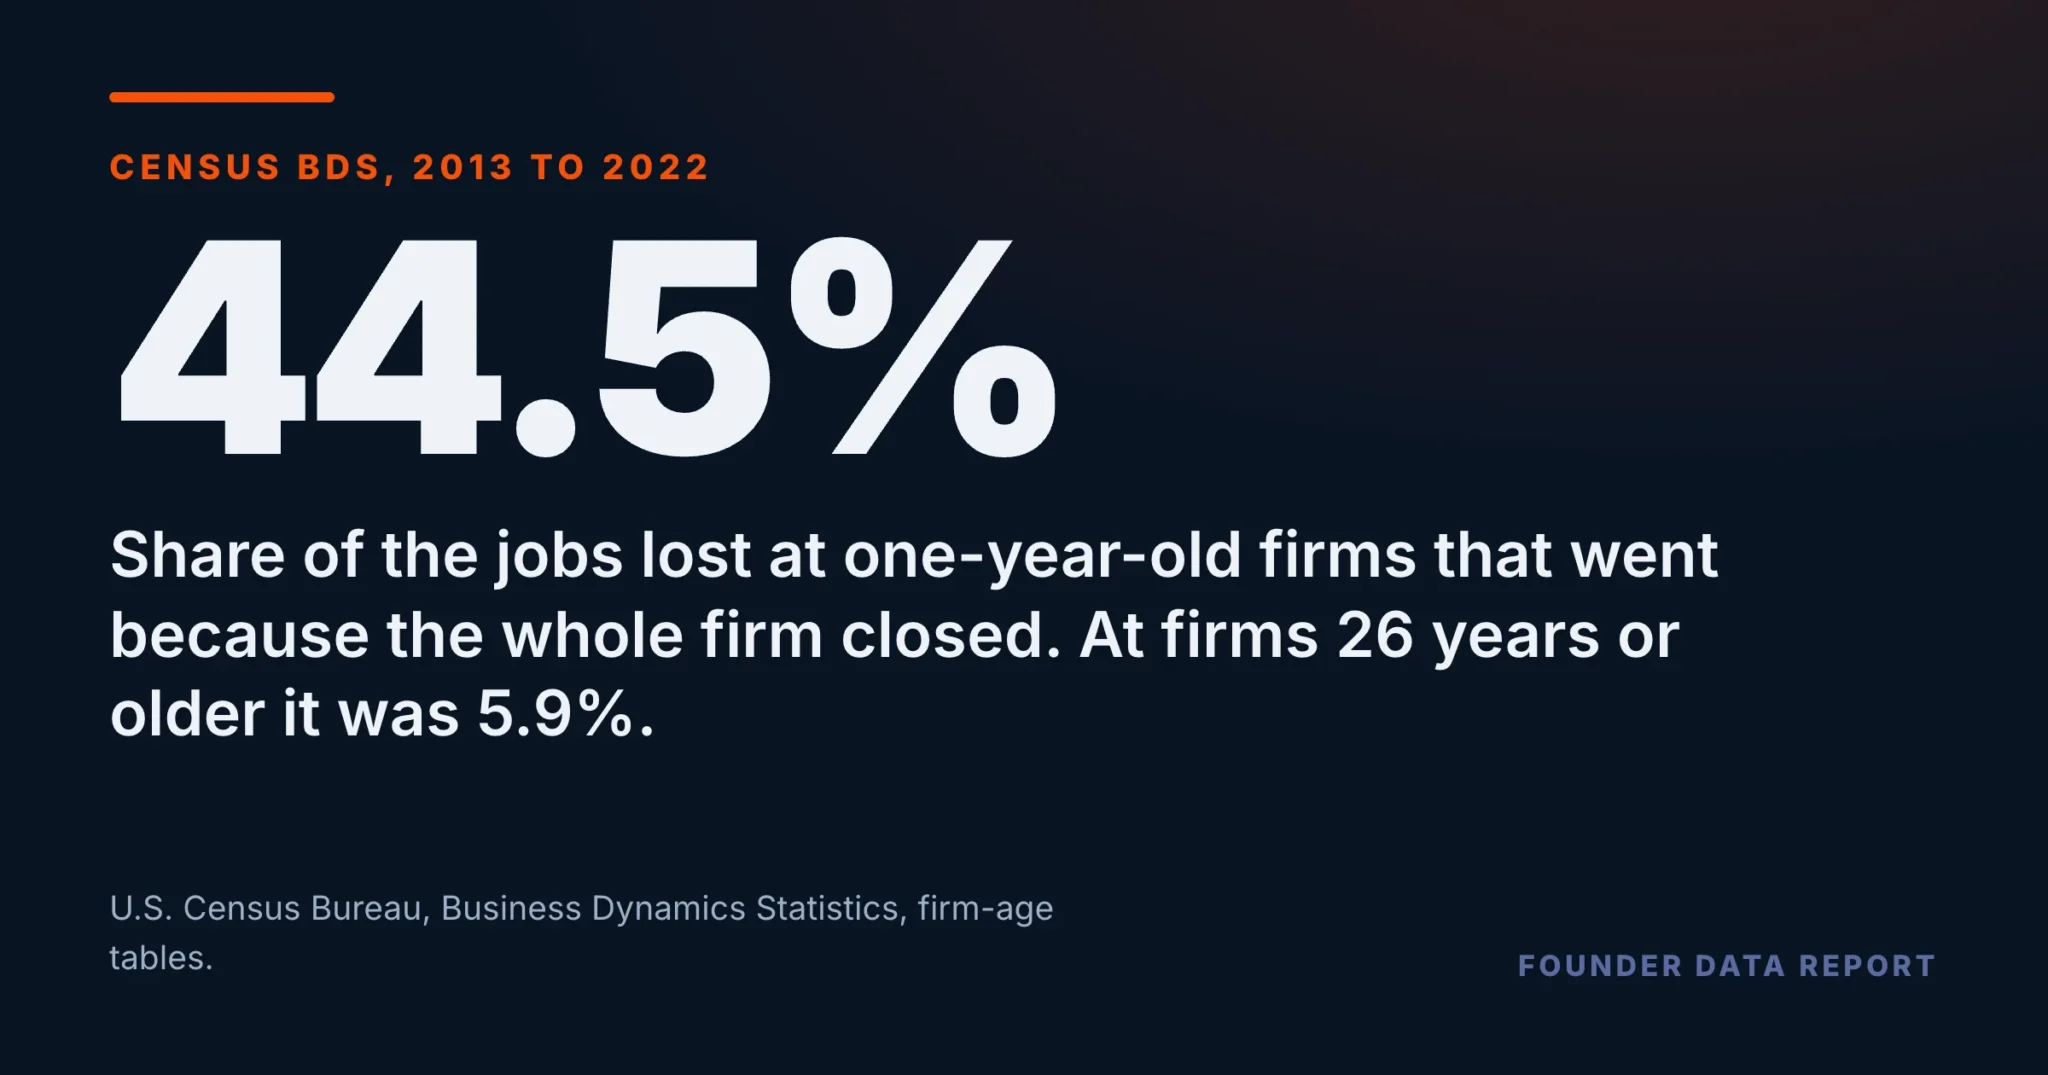
At a One-Year-Old Firm, 44.5% of the Jobs Lost Go When the Whole Business Closes. At 26 Years or Older, 5.9%
You can’t afford to risk your business without a Sidekick at your side.
When a young business loses jobs, close to half go with the business itself. When an old one does, it mostly shrinks and carries on. Here is what ten years of federal business records show, age by age.
In the Census Bureau’s Business Dynamics Statistics, ten years combined (2013 to 2022), 44.5% of the jobs lost at one-year-old firms went because the whole firm closed. The share falls with every step in age, to 5.9% at firms 26 years or older. Across all firms it was 15.9%. The rest of the losses came from closing one location while the firm went on, or from shrinking at locations that stayed open, which was 73.4% of the jobs lost at the oldest firms.
- Share of lost jobs that went with a closing firm, 2013-2022 combined: 1 year old 44.5%, 6 to 10 years 27.3%, 16 to 20 years 17.8%, 26 or older 5.9%.
- At one-year-old firms, closing and shrinking each took about the same share, 44.5% and 44.6%. From two years on, shrinking took more every time.
- In every year from 2004 to 2022, one-year-old firms had the highest closure share of any age group and firms 26 or older the lowest.
- The lowest share in the series for firms 1 to 5 years old was the year to March 2021: 29.5%, against 38.4% over the ten years.
- Employer firms only; firm age and firm size move together, and these tables cannot pull them apart.
Three ways a job goes
The Census Bureau’s Business Dynamics Statistics (BDS) follow every employer business in the country from one March to the next. When a job disappears, the records show which of three things happened. The whole firm closed. One of its locations closed while the firm carried on. Or a location that stayed open got smaller. The BDS publishes all three by the age of the firm, which lets you ask how a business of a given age usually loses the jobs it loses.
Over the ten years from 2013 to 2022, the answer moves steadily with age. At one-year-old firms, 44.5% of the jobs lost went because the whole firm closed. At two years it was 39.5%, at five 32.5%, at 6 to 10 years 27.3%, at 16 to 20 years 17.8%. At firms 26 years or older it was 5.9%. Each age group sits below the one before it. Across all firms the share was 15.9%.
Job losses at firms that closed, divided by all job losses at firms of that age, ten years combined. ’26 years or older’ includes firms whose start date is earlier than the records go back. Age groups add to the national total to within 0.03%; Census adds a little noise to protect confidentiality.
U.S. Census Bureau, Business Dynamics Statistics, firm-age tables (BDSFAGE), all sectors, 2013 to 2022 combined, retrieved from www2.census.gov. Each year runs March to March. Job losses are job destruction: the jobs lost at workplaces that closed or shrank. 2023 is a provisional year and is left out.
At one year old, it is an even split
Put the other two routes next to it and the shape gets clearer. At one-year-old firms the jobs lost split almost evenly: 44.5% with a closing firm, 44.6% by shrinking at a location that stayed open, and 10.9% from a location that closed while the firm went on. From two years old onward, shrinking took the larger share in every age group, and by 16 to 20 years it was 70.6%.
The oldest firms lose jobs a different way again. At 26 years or older, closing a location while the firm carried on accounted for 20.7% of lost jobs, more than three times the share that went with the whole firm closing. Shrinking accounted for 73.4%. Those firms are also where most of the losses are: about 52% of all the jobs lost in these ten years were lost at firms 26 or older.
Each row adds to 100%. ‘A location closed, firm went on’ is the jobs at locations that shut while the firm itself kept operating. ‘Shrank’ is the jobs lost at locations that were still open a year later.
U.S. Census Bureau, Business Dynamics Statistics, firm-age tables (BDSFAGE), all sectors, 2013 to 2022 combined, retrieved from www2.census.gov. Each year runs March to March. Job losses are job destruction: the jobs lost at workplaces that closed or shrank. 2023 is a provisional year and is left out.
At a one-year-old firm, nearly half the lost jobs go with the business itself. At a firm 26 or older, about one in 17 does.
The pattern holds year by year
Ten years combined could hide a lot of movement, so it is worth checking each year on its own. In every year from 2004 to 2022, one-year-old firms had the highest closure share of any age group and firms 26 or older had the lowest. In 15 of those 19 years the share fell at every single step in age; in the other four, two neighbouring age groups swapped places somewhere in the middle.
For firms 1 to 5 years old taken together, the share was 38.4% over the ten years and stayed above 34% in every year back to 1979 except one. The exception was the year to March 2021, when it fell to 29.5%, the lowest in any year back to 1979. The share for all firms was also at its lowest that year, 11.4%. The records show the drop; they do not say what was behind it.
Each point is one year, March to March, labelled by the year it ends. The axis starts at zero. The low point is the year to March 2021, the lowest in any year back to 1979.
U.S. Census Bureau, Business Dynamics Statistics, firm-age tables (BDSFAGE), all sectors, each year 2012 to 2022 on its own, March to March, retrieved from www2.census.gov.
What to take from this if you run a young one
If your business is in its first few years, the records say the jobs it loses are much more likely to go all at once, with the business itself, than the jobs at an older firm. Older firms mostly lose jobs by shrinking and keep going. That is a reason to treat the early years as the stretch where staying open is the main thing to protect, and to watch for the point where your own business starts to have room to shrink instead.
Three limits. These are employer firms only, counted each March. Firm age and firm size travel together, since young firms are mostly small, and these tables cannot separate the two; the size view is in the related piece below. And the records count what happened to jobs, not why: they cannot say what any owner decided or what a closing firm was up against.
U.S. Census Bureau, Business Dynamics Statistics, firm-age tables, 2013 to 2022 combined.
Frequently Asked Questions
Do young businesses lose jobs mostly because the whole business closes?
Not quite: close to half. Over 2013 to 2022, 44.5% of the jobs lost at one-year-old firms went because the whole firm closed and 44.6% by shrinking, according to the Census Bureau's Business Dynamics Statistics. Add the 10.9% lost when one location closed while the firm went on, and 55.4% went when a workplace closed.
How do older businesses lose jobs?
Mostly by shrinking. At firms 26 years or older, 73.4% of lost jobs came from locations that stayed open, 20.7% from closing a location while the firm went on, and 5.9% from the whole firm closing.
What share of all job losses come from businesses closing?
Across all employer firms, 15.9% of the jobs lost from 2013 to 2022 went with a firm that closed, 15.8% with a location that closed while its firm went on, and 68.3% by shrinking.
Is this about firm age or firm size?
The tables are by firm age. Young firms are mostly small, so age and size move together, and these tables cannot separate them. The size view is in the related piece on how the smallest firms lose jobs.
Where does the data come from?
The U.S. Census Bureau's Business Dynamics Statistics, firm-age tables, all sectors, national, 2013 to 2022, downloaded from www2.census.gov. 2023 is a provisional year and is left out.
Published by The Lonely Entrepreneur — the community and coaching platform for entrepreneurs who are building alone. lonelyentrepreneur.com
This article is for educational purposes and is not a substitute for professional financial or legal advice.