

 Founder Data Report
The Average Company Spends 9% of Revenue on Marketing. The Median Spends 5%.
Get clarity — download the free Entrepreneur Survival Guide Summary.
Every marketing budget conversation starts with someone quoting an average. The primary data says the average describes almost nobody — and the gap between the mean and the middle is where founders overcommit.
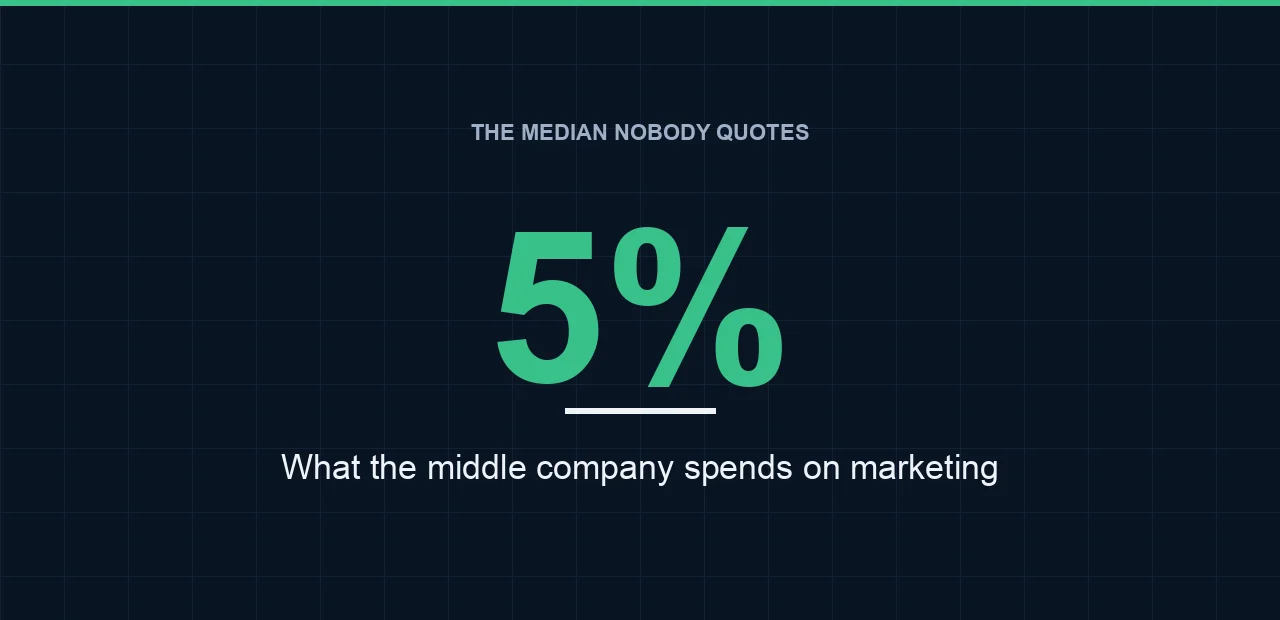
Quick answer: Marketing expenses run a mean of 8.96% of company revenues and a median of 5% (The CMO Survey, 2026). Both numbers are correct and they answer different questions. The mean is pulled upward by a long tail of heavy spenders — the highest figure reported in that survey was 42.99% of revenue. The median tells you where the middle company actually sits. If you are benchmarking a budget, use the median as your floor and the mean as your ceiling, and do not treat either as a rule.
- Marketing as a share of revenue: mean 8.96%, median 5% (The CMO Survey, 2026, n = 154).
- The gap exists because a handful of firms spend up to 43% of revenue and drag the average up.
- As a share of total company budget the figures are higher: mean 9.64%, median 7%.
- Gartner puts large enterprises at 7.8% of revenue in 2026, essentially flat from 7.7%.
- Overall marketing spend grew 1.74% last year; digital spend grew 8.20%.
- Pick the denominator and the percentile deliberately, then defend that number all year.
The average is the wrong number to plan against
Somebody in every budget meeting says companies spend about nine percent of revenue on marketing. They are quoting a real figure from a real survey, and they are still going to lead the room to the wrong decision. The mean in The CMO Survey’s 2026 edition is 8.96%. The median in the same table, from the same respondents, is 5%.
That is not a contradiction. It is a distribution with a long right tail. Some companies — venture-funded, category-creating, fighting for share — spend enormous fractions of revenue on marketing. The highest response in that survey was almost 43% of revenue. A handful of firms like that lift the average well above where the typical company lives.
Source: The CMO Survey, 35th edition, 2026 (Duke University Fuqua School of Business, Deloitte and the American Marketing Association), Topline Report; fielded January 2026. Based on 154 valid responses to the marketing-as-a-percent-of-revenue question.
Plan against the mean and you have quietly committed to spending nearly twice what the typical company spends, on the strength of a statistic nobody in the room examined. That is not aggressive marketing. That is an arithmetic accident.
The full spread, so you can find yourself in it
Benchmarks are only useful when you can see the range they came from. Here is the whole picture from the same survey, with Gartner’s enterprise figure alongside it for reference.
Source: The CMO Survey, 35th edition, 2026 (Duke University Fuqua School of Business, Deloitte and the American Marketing Association), Topline Report; fielded January 2026. Source: Gartner 2026 CMO Spend Survey, 401 marketing leaders in North America and Europe, the majority at companies above $1B in annual revenue. Gartner and The CMO Survey draw different samples — Gartner skews to companies above $1B in revenue — so the two figures are shown side by side, not combined.
A benchmark that spans zero to forty-three percent is not a rule. It is a reminder that the right number depends on what you are trying to buy with it.
Notice how much distance sits between the median and the top of the range compared with how little sits between the median and the mean. That shape is what makes averages misleading in marketing budgets specifically, and it is why the honest answer to “how much should we spend?” always starts with “to do what?”
Percent of revenue or percent of budget? Pick one
Half the confusion in these conversations comes from two people using different denominators. Marketing as a share of revenue and marketing as a share of the company’s overall budget are different questions with different answers, and The CMO Survey reports both.
The middle company’s marketing spend measured against total revenue. The most conservative of the four, and the best starting floor for a small business.
The middle company’s marketing spend measured against total company budget rather than revenue.
The average that gets quoted, lifted by a long tail of heavy spenders reaching up to 42.99% of revenue.
The highest of the four benchmarks. Quoting this one against revenue overstates the real commitment by a wide margin.
Source: The CMO Survey, 35th edition, 2026 (Duke University Fuqua School of Business, Deloitte and the American Marketing Association), Topline Report; fielded January 2026. Revenue figures from 154 valid responses; budget figures from 146.
Decide which denominator you are using before you set the target, write it down, and use the same one in every review for the rest of the year. Most budget arguments I have watched were not disagreements about strategy. They were two people confidently comparing numbers that were never measured the same way.
The budget is flat. The mix is not.
The headline story of 2026 is stability. Gartner puts marketing budgets at 7.8% of company revenue, barely moved from 7.7% the year before, and describes the plateau as running since 2022. Total spend among CMO Survey respondents grew 1.74% over the prior twelve months — inside the noise.
Underneath that flat surface, money is moving. Digital marketing spend in the same survey grew 8.20%, roughly five times the overall rate. Nobody is being handed a bigger marketing budget. Plenty of people are being asked to spend the same budget somewhere different.
Source: The CMO Survey, 35th edition, 2026 (Duke University Fuqua School of Business, Deloitte and the American Marketing Association), Topline Report; fielded January 2026. Source: Gartner 2026 CMO Spend Survey, 401 marketing leaders in North America and Europe, the majority at companies above $1B in annual revenue.
So here is the useful version of the answer. Start at the median — five percent of revenue — as the number you can defend without a case. Move above it only when you can name what the extra points buy: a launch, a new segment, a market you are entering rather than defending. And measure it against the same denominator every quarter, because a budget you can explain is a budget that survives the year.
Frequently Asked Questions
What percent of revenue should a small business spend on marketing?
The median company spends 5% of revenue on marketing and the mean is 8.96% (The CMO Survey, 2026). The median is the better starting point for a small business; move above it only for a specific objective such as a launch or entering a new market.
Why is the average marketing budget higher than the median?
Because the distribution has a long right tail. A small number of companies spend very heavily — the highest response in the 2026 CMO Survey was 42.99% of revenue — which pulls the mean up while the median stays at 5%.
Is marketing spend measured against revenue or total budget?
Both are reported and they differ. The CMO Survey's 2026 figures are a mean of 8.96% and median of 5% against revenue, versus a mean of 9.64% and median of 7% against overall company budget. Choose one denominator and use it consistently.
How much do large companies spend on marketing?
Gartner's 2026 CMO Spend Survey puts marketing budgets at 7.8% of company revenue, up from 7.7% in 2025. That sample skews heavily to companies above $1 billion in annual revenue, so it is not a small-business benchmark.
Are marketing budgets growing in 2026?
Barely, in total. Overall marketing spending among CMO Survey respondents rose 1.74% over the prior 12 months while digital marketing spending rose 8.20% — the budget is flat but the mix is shifting toward digital.
Published by The Lonely Entrepreneur — the community and coaching platform for entrepreneurs who are building alone. lonelyentrepreneur.com
This article is for educational purposes and is not a substitute for professional financial or legal advice.